2020 Retrospective: New Country, New Role, New Habit
2020 has been a year of challenges and growth. Amidst the pandemic, I moved halfway across the globe for a new role, and started writing more. Here’s the year in review.
New country, New role
I joined Amazon in January and moved halfway across the world, from sunny Singapore to rainy Seattle. Here, I build recommender and machine learning systems to serve millions of readers worldwide. The goal is to help them read more, and get more out of reading. This mission is aligned with my values, and being able to contribute at such scale is exciting.
Amazon’s a big company with established processes, infrastructure, and teams. I’m learning lots about how to scale myself via writing (better) documents, designing and shipping scalable systems, and building collaborative relationships to deliver results.
Although Amazon is large, my team is lean, with one data scientist, two applied scientists, and four software engineers—this pushes us to be creative in designing lean systems to minimize development and operations cost. Part of this involves using managed services (e.g., SageMaker, managed Spark, Airflow) to scale ourselves and minimize ops.
My sole 2020 resolution: Writing weekly
I also doubled down on my writing habit, increasing the frequency from monthly to weekly. After finishing my CS masters in 2019, I had some newfound free time. The pandemic, shelter-in-place, and work-from-home also contributed to this habit.
What did I write about? I initially wrote whatever was on my mind, such as an easier way to write and using a Zettelkasten to take notes. This included summaries from my learning (e.g., serendipity metrics, NLP survey) and conferences (e.g., spark summit, recsys).
I also started sharing my thinking on effective data science and machine learning, such as how to maintain ML in production, test ML code, and why I love scrum. This included what I thought would be an unpopular opinion on why data scientists should be more end-to-end (which turned out to be fairly popular).
As readers got to know me, they also reached out with questions. Responding in writing on this site was a great way to answer those questions at scale. I answered questions about my productivity habits (with a guest post by Susan Shu!), why read papers, the importance of writing for tech roles, why have a portfolio, and the difference between data/ML roles.
There was also writing that wasn’t related to data science or ML. Nonetheless, I wanted to explore these topics (and get it out of my system). I had a great time writing these, such as Commando, Soldier, Police, Beginner’s mind, the 85% rule, and life lessons from ML.
How has this habit paid off so far? I found myself learning better (having to write about it for others forces me to think clearer) and making great friends (through people reading my writing, and me reading theirs).
I’ve also gained a small audience on my site and social media. Let’s examine this via some charts and stats. For statistics before 2020, click below 👇.
Before 2020: Statistics from the previous Wordpress site
Here’s statistics courtesy of WordPress, from before the migration in August 2019.
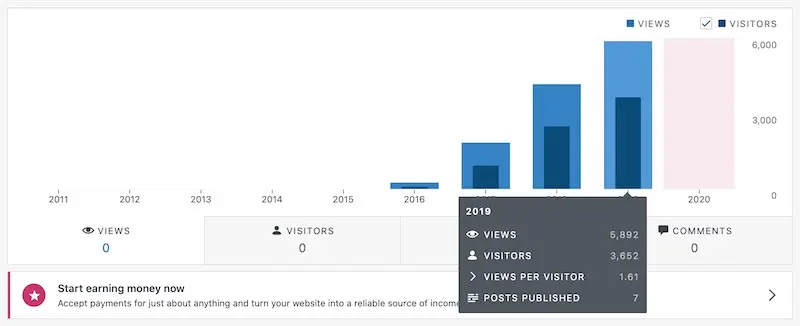
Statistics from Wordpress, before the current site
Site content: Common themes in my writing
In 2020, I wrote 55 posts, including this one. Reflecting on the word cloud below, I see some common themes such as: (i) data & machine learning, (ii) problem & product & user & people, (iii) project & team & time, and (iv) writing & coding & learning.
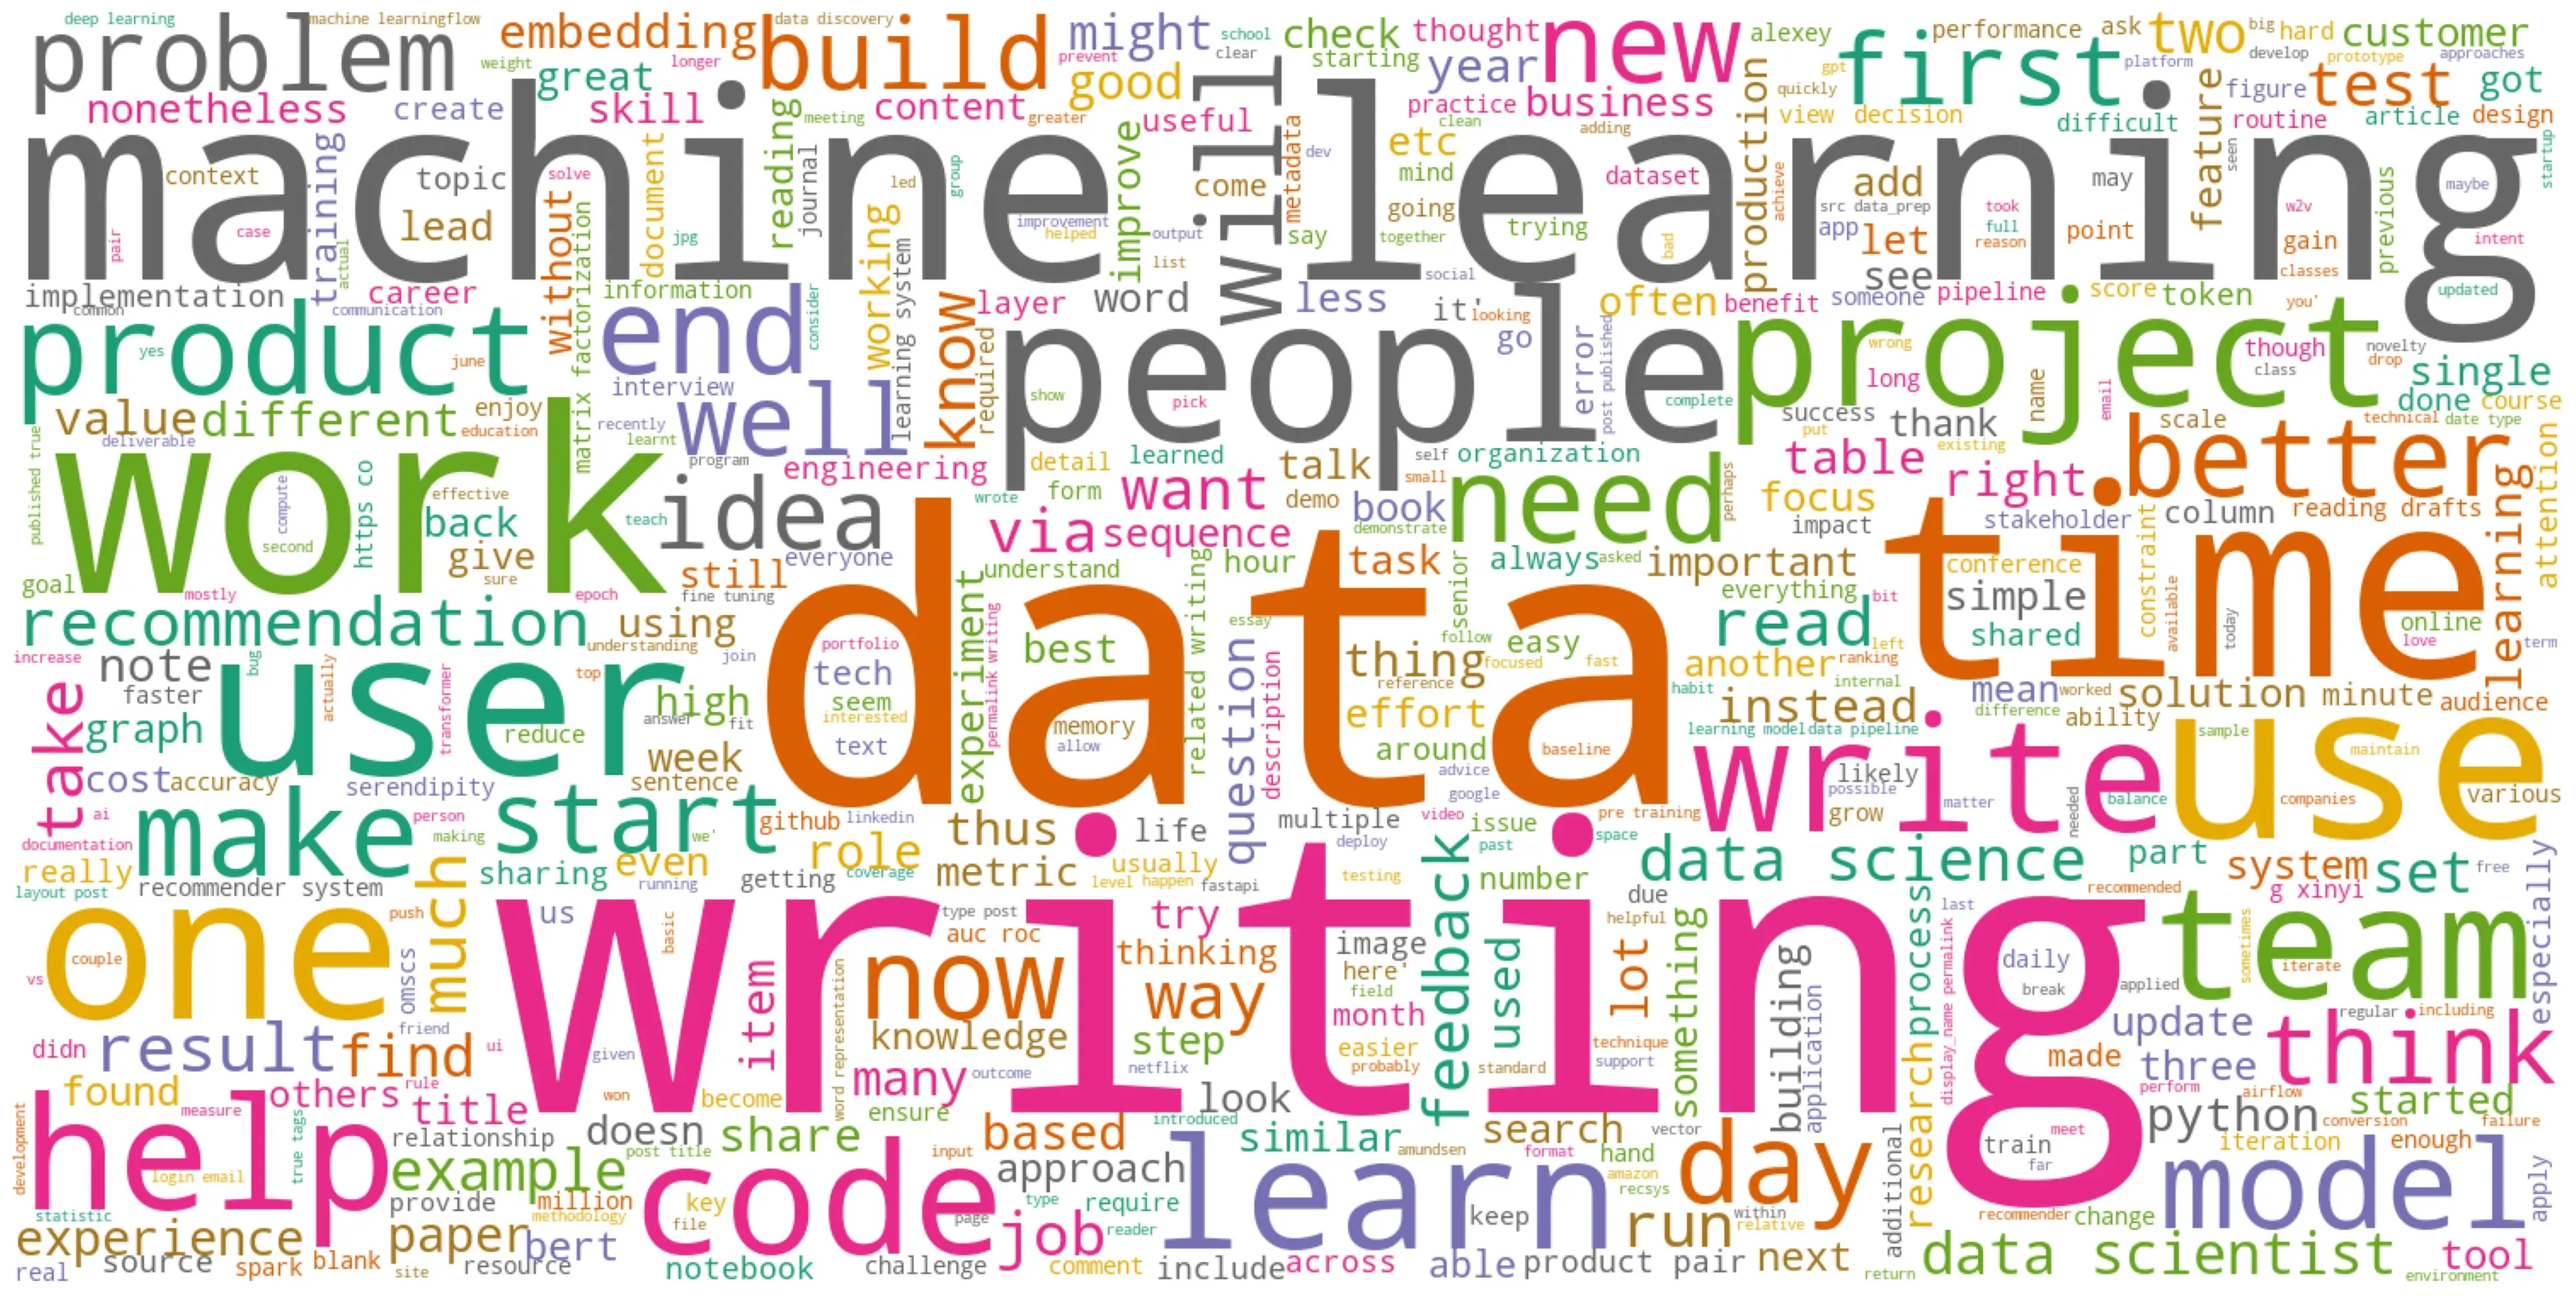
Wordcloud of my 55 posts in 2020 (Words closer to each other occur together more often)
Site traffic: Spikes and explanations
Total page views (260k) is beyond expectations. (I didn’t expect anyone to want to read my writing!) Traffic is spiky. Two huge spikes made the rest of traffic look flat. Both were due to Hacker News. The first one was about my journey into data science while the second one was about my note-taking approach.
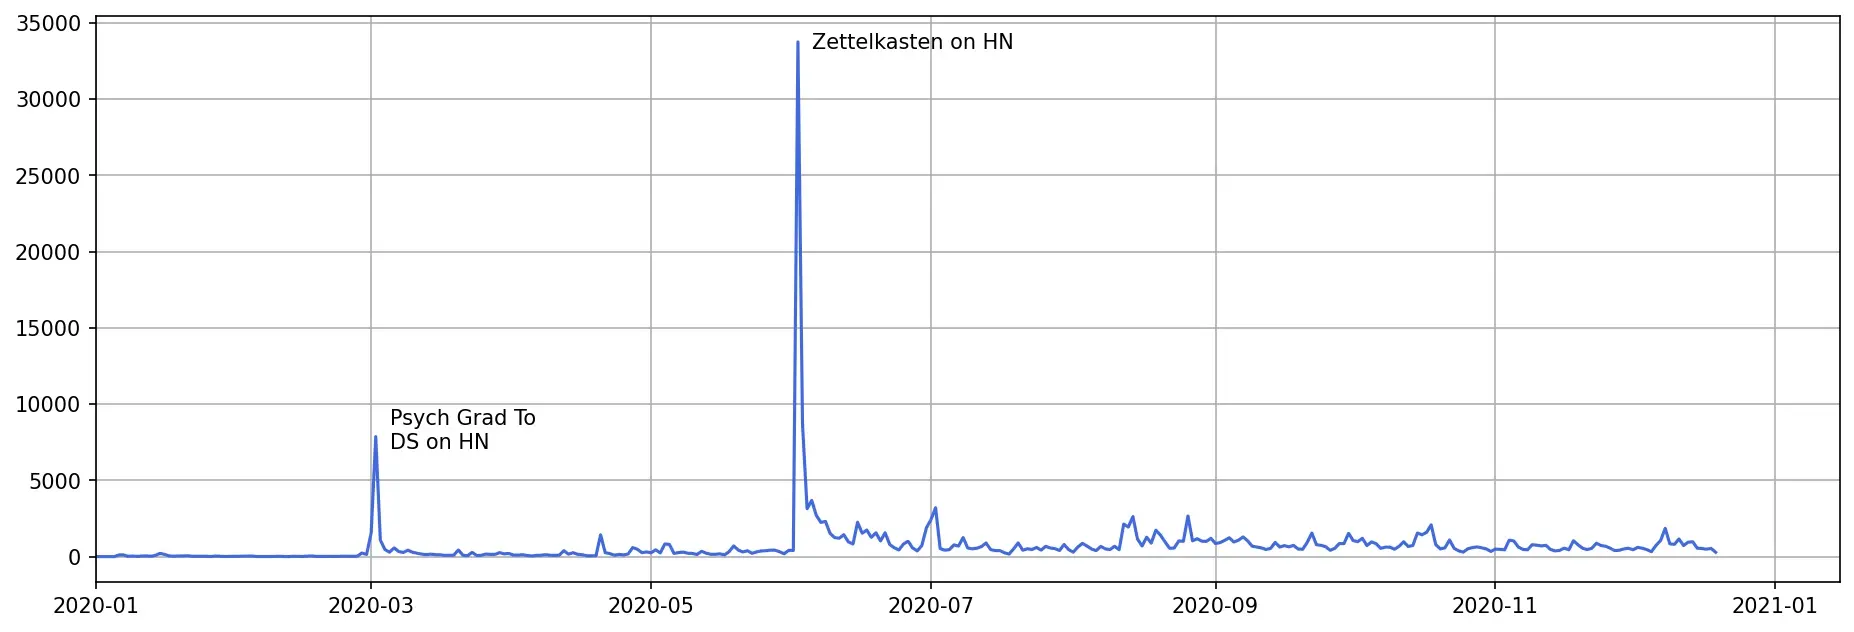
The two main traffic spikes came from Hacker News
On a smaller scale, we see some small spikes in the latter half of the year. These were due to posts being shared on social (e.g., Twitter, Facebook) or some giant mailing list (e.g., O’Reilly Data & AI, Data Elixir, Data Science Roundup, etc.).
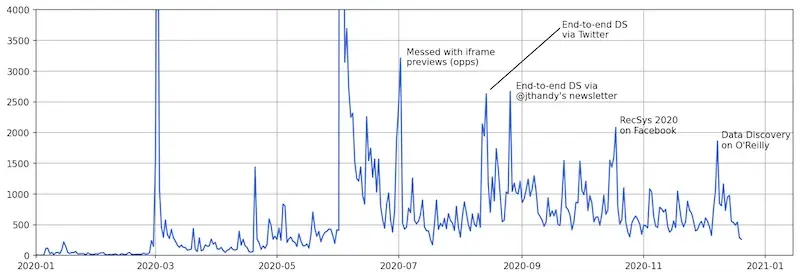
Several smaller spikes from social and email lists
Excluding the Zettelkasten post, here are the top posts by page views:

Top posts in 2020 by page views
For more recent metrics, you can refer to 30-day metrics.
Regardless of traffic, my self-selected “most impactful posts” are:
- The 85% rule: With remote working, we might be prone to working longer (and burnout). This 3-minute post reminds us that pushing too hard can be suboptimal.
- Guide to maintaining ML in Production: This helped many teams start thinking about MLOps. Also, several data/ML teams reached out for implementation advice.
- Data Scientists Should be More End-to-End: Other data scientists shared their views on this (see tweet below), mostly agreeing that this approach is more effective. Hopefully, it reverses the unhealthy trend of over-specialization.
Unpopular view: Data scientists should be more end-to-end.
— Eugene Yan (@eugeneyan) August 12, 2020
While this is frowned upon (too generalist!), I've seen it lead to more context, faster iteration, greater innovation—more value, faster.
More details and Stitch Fix & Netflix's experience 👇 https://t.co/aOBjuBSsSz
With regard to Google Search ranking, while I’ve never tried to deliberately optimize for SEO, my site still manages to get some traffic.
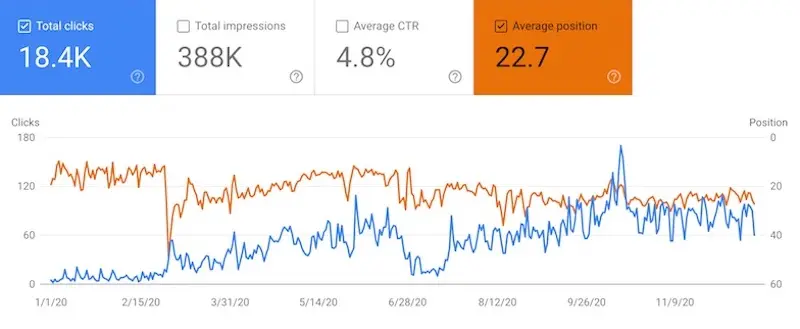
Here's how Google Search ranked my site in 2020
Aside: Goggle Analytics vs Cloudflare on traffic stats
I use Cloudflare as a CDN and it also provides traffic stats. Comparing Google Analytics (GA) to Cloudflare, GA seems to only track 40% of unique visitors.
This could be due to several reasons, such as browsers blocking the GA javascript (my browser does this) and Cloudflare considering non-human traffic (e.g., bots, scrapers) in the unique visitor count. So take both figures with a pinch of salt.
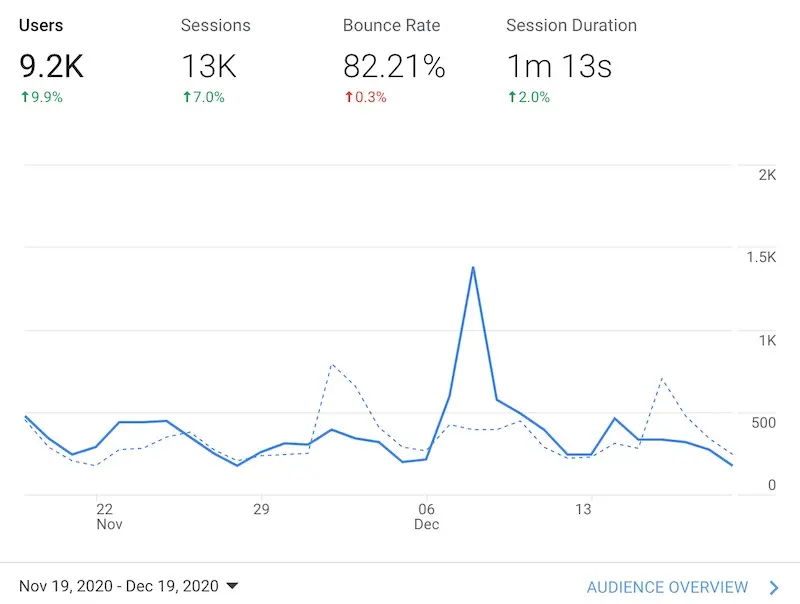
Users in past 30 days on Google Analytics
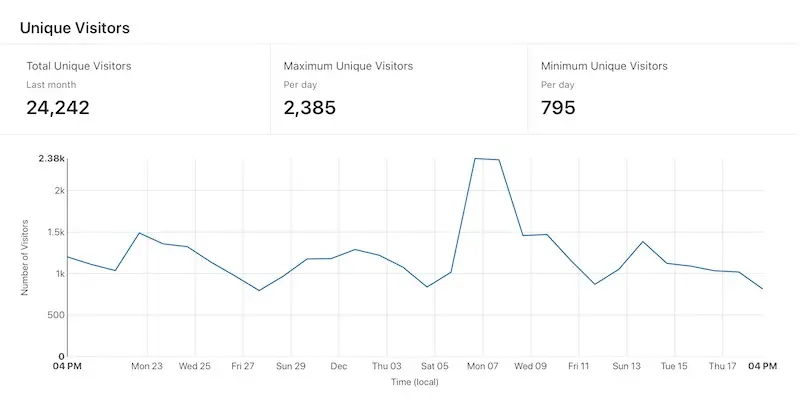
Users in past 30 days on Cloudflare
Email list: Building my friends list old-school
With the encouragement of my friend Gabriel, I started letting readers subscribe for new posts. I initially used Substack but switched to ConvertKit as it was more flexible. Here’s how subscribers have grown in 2020.

Email list growth in 2020 (It starts at 30 as i migrated from Substack)
And here’s the daily subscribes/unsubscribes. There’s probably a strong correlation with site traffic though I’ve not gone as far as running a statistical analysis. (If only I could download this data from ConvertKit 🤔.)

Daily subscribes/unsubcribes in 2020
Want to try ConvertKit? Please use my referral code 🙏. You’ll get 1,000 subscribers free, and I get 100 more email list capacity.
Here’s open-rate over time. There seems to be a slight downward trend.
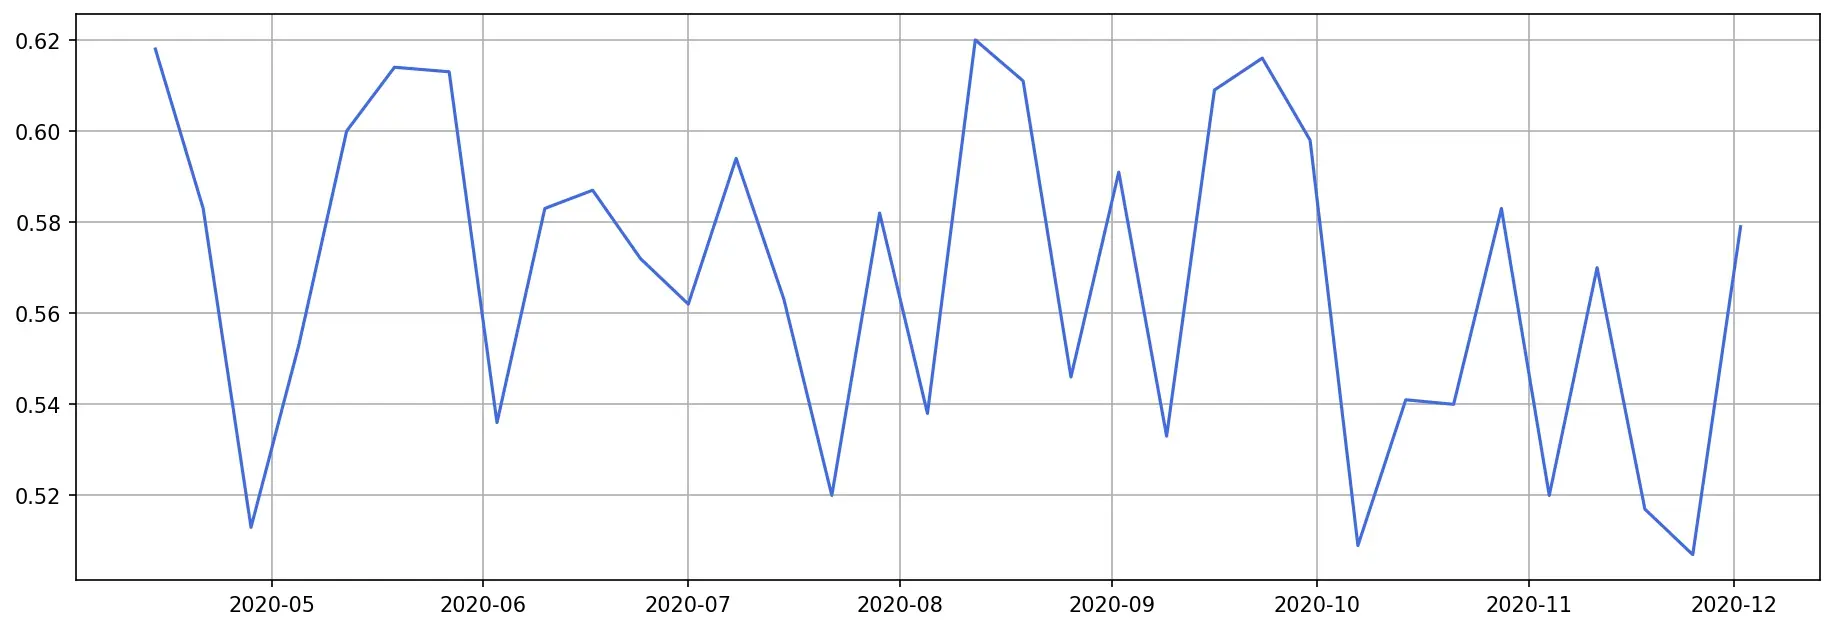
Email open-rate in 2020
And open-rate grouped by themes. Unsurprisingly, posts about machine learning and data science have the highest open rates. Also, the two posts on productivity (my approach and Susan’s) had super high open rates; perhaps I should write more about productivity.
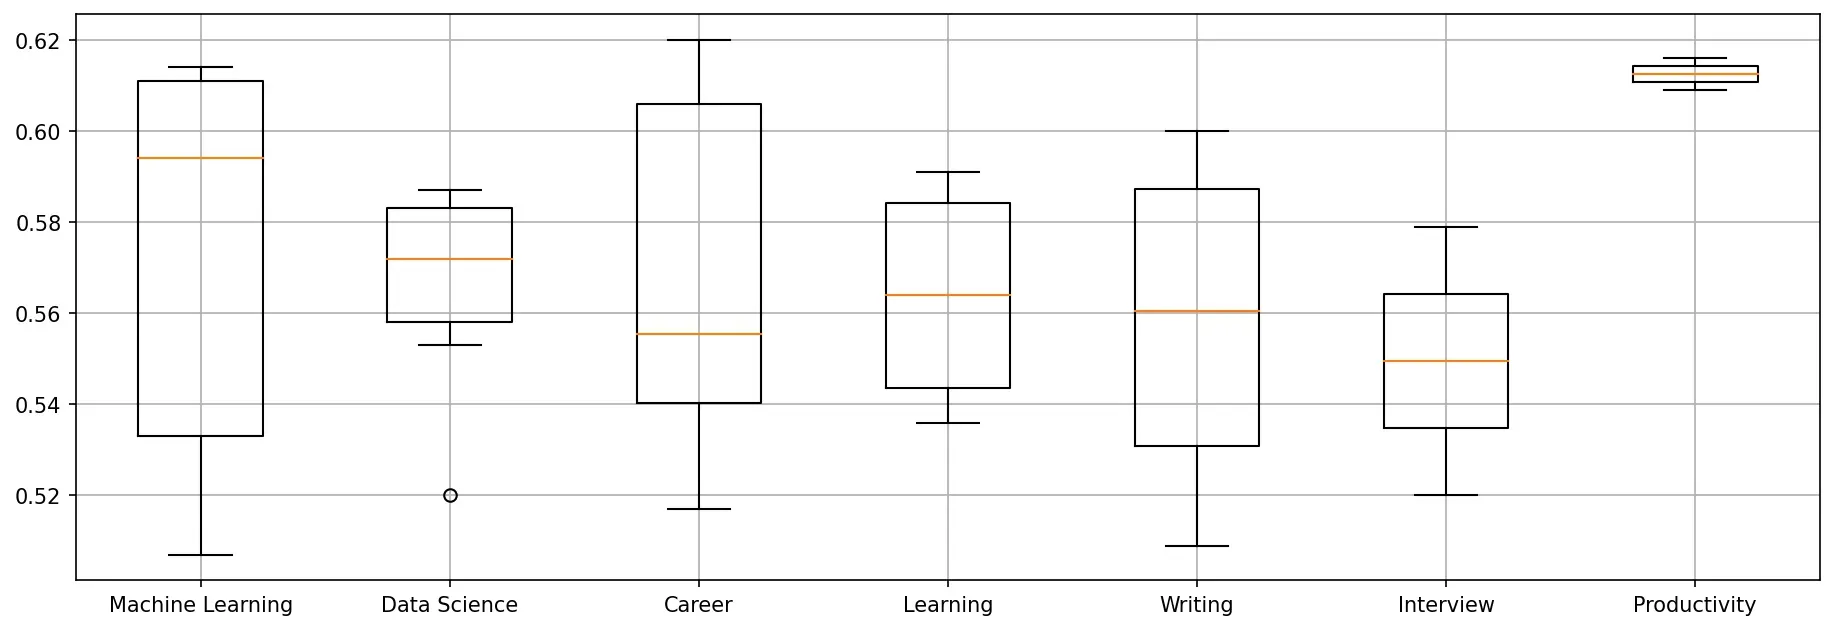
Email open-rate in 2020 by themes
Social: Making friends at the internet’s water cooler
I revived my Twitter account (also with Gabriel’s encouragement). Initially, I wasn’t sure how to use Twitter but have since found it useful for getting the latest ideas on topics of interest (i.e., data, machine learning, engineering) and discussing my ideas and writing. Here’s how follower count has grown. 90 followers in Mar; 2,175 followers as of 19 Dec.

Twitter follower cumulative growth in 2020
And the weekly breakdown. Again, seems correlated with site traffic and email subscribes.

Twitter follower weekly gain in 2020
For LinkedIn, I don’t recall my follower count in 2019. In 2020, it grew to 4,303.
GitHub: Sharing code and resources
In 2020, I began sharing my work more openly on GitHub, starting with my tinkering with PyTorch and Amazon’s datasets for recommendations, as well as my workflow for setting up Python projects, testing ML, and rapid experimentation with papermill and mlflow.
Unexpectedly, what people found most useful (based on the number of stars) were two repos of papers. The first, applied-ml is a curation of papers and blogs by organizations sharing their work on data science & ML in production. The other, ml-surveys is a curation of survey papers of advances in machine learning. Together, they received >5k stars.
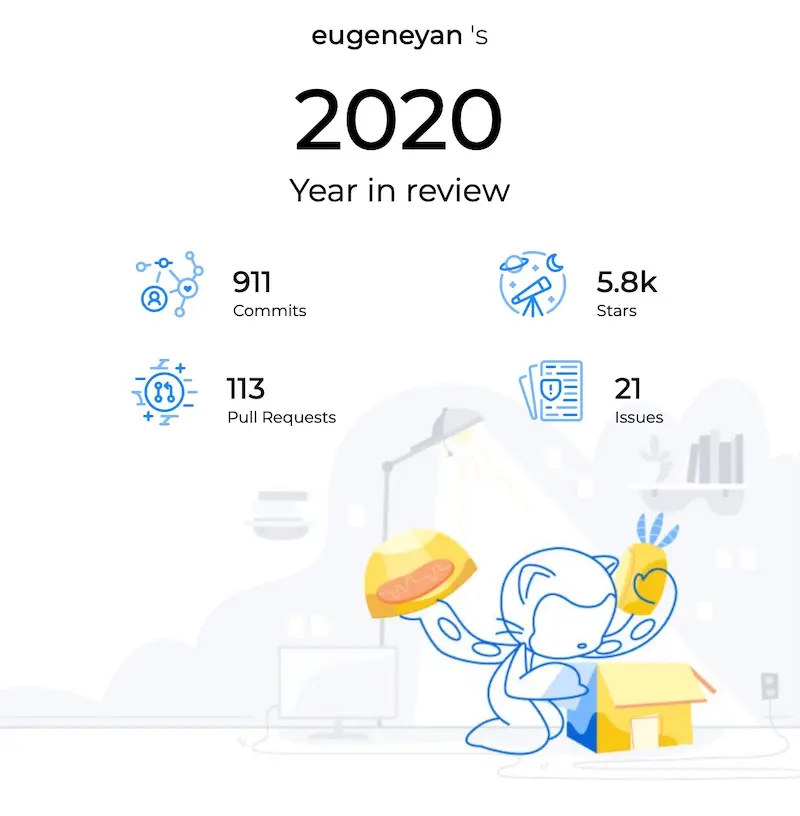
GitHub Stats for 2020 (source)
• • •
That’s it for 2021. Hope you enjoyed the visuals, and have some bright spots and made progress in 2020. Till next year!
In 2020, I moved across the globe to start a new role with Amazon, and focused on one habit—writing weekly.
— Eugene Yan (@eugeneyan) December 23, 2020
Here's a retrospective, with statistics on writing themes, site traffic, subscriber count, etc.https://t.co/FS1UzPTZH4
Did you do a review/reflection too? Comment here!
Thanks to Yang Xinyi for reading drafts of this, and to Paul Vallejo for attributing the second End-to-End DS spike to Tristan Handy’s newsletter.
If you found this useful, please cite this write-up as:
Yan, Ziyou. (Dec 2020). 2020 Retrospective: New Country, New Role, New Habit. eugeneyan.com. https://eugeneyan.com/writing/retrospective-2020/.
or
@article{yan2020review,
  title   = {2020 Retrospective: New Country, New Role, New Habit},
  author  = {Yan, Ziyou},
  journal = {eugeneyan.com},
  year    = {2020},
  month   = {Dec},
  url     = {https://eugeneyan.com/writing/retrospective-2020/}
}
Share on:
Browse related tags: [ productivity life ] or
Join 11,800+ readers getting updates on machine learning, RecSys, LLMs, and engineering.