My Notes From Spark+AI Summit 2020 (Application-Specific Talks)
To follow up with the previous write-up on application-agnostic talks, here’s my notes on some application-specific sessions.
The previous write-up largely focused on deep learning best practices and reflects the challenges people are facing now. This write-up focuses on data engineering (frameworks, data quality) and reflects the maturity of Spark in production, with organizations sharing how they apply it effectively. We also have two interesting talks on unsupervised learning and reinforcement learning.
Table of Contents
- Airbnb’s Zipline, a feature engineering framework
- Airbnb’s Sputnik, a data engineering framework
- Gojek’s Feast, a feature store for end-to-end machine learning
- Netflix’s approach to data quality via statistics and swim lanes
- LinkedIn’s approach to preventing abuse via unsupervised learning
- Zynga’s approach to personalisation via reinforcement learning
Zipline: Declarative Feature Engineering (24 June)
Nikhil Simha, Senior Engineer at Airbnb’s ML Infra, shared about Zipline (similar talk at Strata 2018) and how Airbnb uses it to tackle the problem of collecting point-in-time (PIT) features.
What are PIT features? At Point 1 (P1), the latest PIT features are F1=7, F2=3, F3=8. However, at P2, the latest PIT features for F1 and F2 have changed to 4 and 2 respectively. Calculating these PIT features (from historical data) is very difficult—it usually involves some aggregation on last and temporal joins. (Also addressed in Gojek’s Feast talk below.)
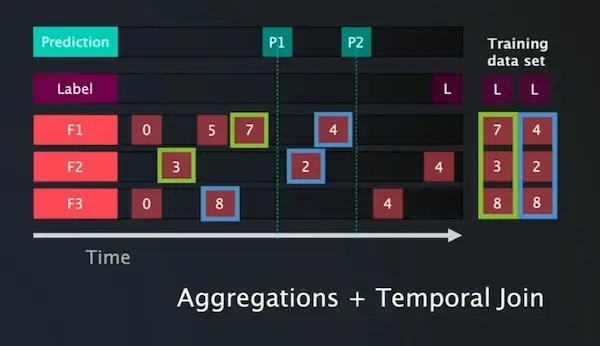
Getting those last values are tricky, especially if the data is at the second/minute level
We can collect PIT features via two approaches:
- Log-and-wait: Write code to start collecting PIT features via logging and wait 3-6 months for sufficient data.
- Manual backfill: Replicate feature engineering logic on historical data and perform backfilling. This comes with problems of consistency and can take a long time.
To improve on the manual backfill approach, it’s useful to distinguish between two classes of aggregations. The first class of aggregations are Abelian groups, such as sum, count, etc. They have the following properties:
- Commutative:
a + b = b + a - Associative:
(a + b) + c = a + (b + c) - Reversible:
(a + b) - a = b
With commutativity and associativity, we can parallelize via the map-reduce paradigm. With reversibility, we don’t have to compute on the full window with each update: Just subtract the outdated data and add the new data (e.g., moving average).
However, the second class of aggregations are non-reversible. These are operations like min, max, count unique, etc. With max, we cannot update windows easily—all you would have stored is the max value. Nonetheless, we can get past this with a binary tree.
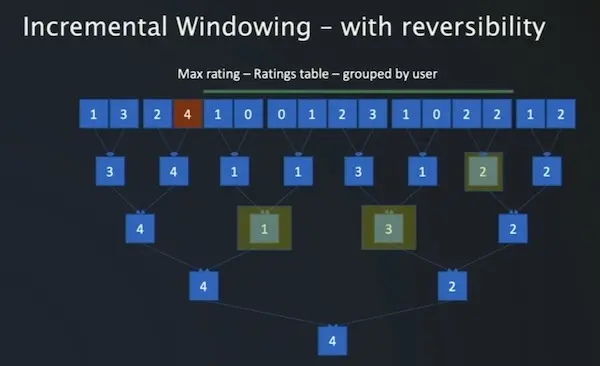
We can do quick non-reversible aggregations with a binary tree.
In the example above, we perform the max operation on every two periods to get the first level node, and repeat recursively. This reduces the problem space from O(N) to O(LogN) and the compute time from O(N^2) to O(NLogN). We trade off faster compute (Log(365) = 8.5) for more storage required (2x).
Further reading:
- Zipline: Airbnb’s Machine Learning Data Management Platform with Nikhil Simha and Andrew Hoh (slides)
- Zipline: Airbnb’s Machine Learning Data Management Platform
Sputnik: A Data Engineering Framework (25 June)
Egor Pakhomov, Senior Software Engineer at Airbnb Infra, shares about how Sputnik bakes in Spark and engineering best practices and improve developer experience.
There’s two kinds of logic in Spark jobs (and code):
- Job logic: Business logic, specification of input and output tables, partitioning of data, and how to validate the result, etc.
- Run logic: Parsing arguments, creating
SparkSession, scheduling, creating tables, I/O, running indev, etc. (mostly boilerplate).
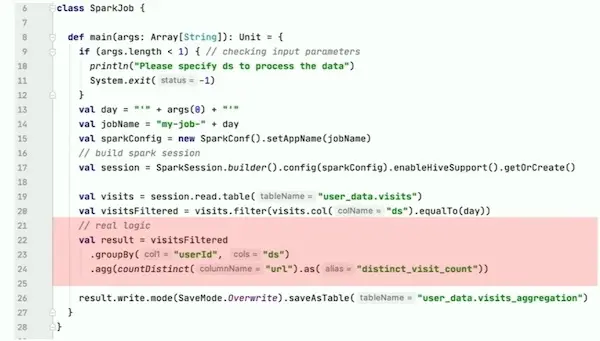
Most of the code in a Spark job is boilerplate; little of it is the actual transformation.
Sputnik implements the run logic so data engineers can focus on the job logic. Sputnik jobs are simple: input -> transformation -> output; no boilerplate.
Sputnik also bakes in best practices. Take for example, the HiveTableWriter. It does the following with minimal effort from data engineers:
- Creates a table if it does not exist; updates metadata
- Repartitions data to reduce the number of files on disk
- Runs data checks before writing (e.g., zero count check)
- Updates output table names (for
dev,staging,prod) - Normalizes
DataFrameschema to follow output schema
The last feature is interesting. By default, Spark’s HiveWriter matches columns by position—instead of name—and casts the data into the Hive schema. Thus, incorrect values are written into columns without error. (SPARK-14543).
Sputnik also makes backfill jobs more efficient. Usually, backfilling a job involves running it for each session (e.g., day) in the historical period. This reduces economies of scale (e.g., starting a new SparkSession each time, batching daily instead of monthly). Sputnik also batches historical jobs across the entire history, or multiple periods per run to fit the resource constraints.
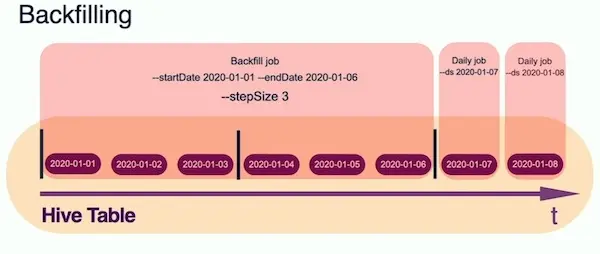
Sputnik makes backfilling easy and efficient.
Sputnik also has utils for testing on a singleton SparkSession, with DataFrame comparison, loading data from csv/json, and cleaning the Hive store between runs. It also checks data on output (e.g., zero-count check). And if we re-run a job (e.g., original output erroneous), it also triggers the re-run of downstream jobs.
Further reading:
Feast: Scaling End-to-End Machine Learning (25 June)
Willem Pienaar, Data Science Platform Lead at Gojek, shares about how they developed Feast (Feature Store) to modularize end-to-end machine learning.
When Gojek started, they had a monolithic, tightly-coupled, system that was hard to iterate on. Training code had to be rewritten for serving, leading to code duplication, high overhead, and inconsistency between training and serving features. There was minimal feature reusability and data quality monitoring.
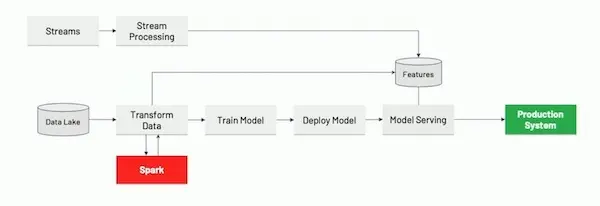
The original monolith made iteration slow and brittle.
Thus, they built Feast to decouple the ML lifecycle. By providing a consistent interface, Feast allows separate teams and data developers to work on creating features, training models, and serving models independently.
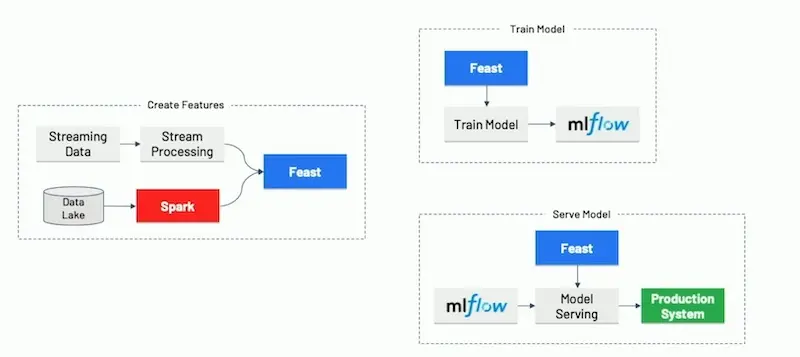
With Feast, the end-to-end machine learning pipeline is modularized.
For the data pipeline, we see various data sources (streaming, SQL, data lake) go through Apache Beam as an ingestion layer—thus, they adopt Google’s Dataflow model.
Aside: Google’s Dataflow model
In most extract-transform-load (ETL) jobs, data is viewed as a bounded batch (e.g., daily batches). The Dataflow model proposes viewing it as an unbounded stream instead (e.g., session). This provides flexibility where streams can easily be aggregated into batches; in contrast, going from batches to streams is very difficult.
Here’s the abstract from the paper (emphasis mine):
Unbounded, unordered, global-scale datasets are increasingly common in day-to-day business (e.g. Web logs, mobile usage statistics, and sensor networks). At the same time, consumers of these datasets have evolved sophisticated requirements, such as event-time ordering and windowing by features of the data themselves, in addition to an insatiable hunger for faster answers. Meanwhile, practicality dictates that one can never fully optimize along all dimensions of correctness, latency, and cost for these types of input. As a result, data processing practitioners are left with the quandary of how to reconcile the tensions between these seemingly competing propositions, often resulting in disparate implementations and systems.
We propose that a fundamental shift of approach is necessary to deal with these evolved requirements in modern data processing. We as a field must stop trying to groom unbounded datasets into finite pools of information that eventually become complete, and instead live and breathe under the assumption that we will never know if or when we have seen all of our data, only that new data will arrive, old data may be retracted, and the only way to make this problem tractable is via principled abstractions that allow the practitioner the choice of appropriate tradeoffs along the axes of interest: correctness, latency, and cost.
In this paper, we present one such approach, the Dataflow Model, along with a detailed examination of the semantics it enables, an overview of the core principles that guided its design, and a validation of the model itself via the real-world experiences that led to its development.
View the full paper here.
For storage, Gojek has a historical feature store (likely based on Hive or BigQuery) and an online feature store (Redis, Cassandra). MLflow is used to log model training parameters and metrics, and also to track models for serving. TensorFlow Extended and TensorFlow Data Validation is used for statistical data validation with visualisation using Facets.
Further reading:
- Feast: Bridging ML Models and Data
FeastGitHub- The Dataflow Model: A Practical Approach to Balancing Correctness, Latency, and Cost in Massive-Scale, Unbounded, Out-of-Order Data Processing
- Facets: An Open Source Visualization Tool for Machine Learning Training Data
Data Quality at Netflix for Personalization (24 June)
Preetam Joshi and Vivek Kaushal, Senior Software Engineers at Netflix, share two approaches they adopt to tackle poor data quality at source and introduced via ETL.
Aside: ETL smells
There are three forms of “ETL smells”:
- Fluctuations: We expect 1 - 2 million rows of data hourly, but it suddenly fluctuates to 0 - 5 million, suggesting possible ETL bottlenecks.
- Drastic drops: We expect 5 million rows of data daily, but it suddenly drops to 1.5 million.
- Under utilisation: We collect 5 million rows of data daily, but recently only 1 million rows were used, suggesting wastage and potential savings.
Tracking the last point led to savings on 15% of storage costs.
Bad data gets introduced in two main ways: At source and via ETL.
To detect errors at the source, we compare the distribution of values between the previous and current period. However, at any day, there could be hundreds of distribution mismatches—to prune it, we can apply the Kolmogorov-Smirnov statistical test.
In a nutshell, the KS test computes the maximum discrepancy between two cumulative distributions (the vertical red line below) and ranges from 0 - 1. Larger values indicate greater discrepancy.
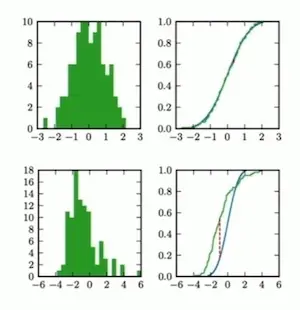
We can use the Kolmogorov-Smirnov test to check for discrepancies between two continuous distributions.
Question: The KS test would work on continuous values—what about discrete or categorical values?
Answer: For discrete values, we perform simple checks (likely comparing key category proportions).
To detect errors in ETL pipelines, we see the approach of “swim lanes”. Let’s say we want to add or update an attribute (i.e., column) in an existing pipeline. The code would be developed and checked into a dev branch. Then, both dev and master branches would run in separate swim lanes on identical sets of sampled data. The output is compared to ensure the rest of the columns are unchanged.
Having these data quality processes led to:
- 80% proactive detection of issues
- 15% cost savings due to better detection of unused data
- 99% validation during critical data migrations with swim lanes
- Improved developer productivity
Further reading:
- MIT Statistics for Research Projects (Nonparametric statistics and model selection)
- Anomaly Detection for Data Quality and Metric Shifts at Netflix
- An Approach to Data Quality for Netflix Personalization Systems
Aside: Another great talk on data quality
SuperConductive also had a great talk on data quality (Automated Testing For Protecting Data Pipelines From Undocumented Assumptions, 26 June).
They shared about the Great Expectations (an open-source project) that lets you declare data expectations (i.e, tests) simply. It streamlines the deployment and running of tests, and storage and exposure of results.
Preventing Abuse via Unsupervised Learning (24 June)
James Verbus and Grace Tang, Machine Learning Engineers at Linkedin, share about the challenges in identifying abuse and fraud, and how they apply unsupervised machine learning to tackle it.
Catching abuse and fraud (and in general, anomalies) has unique challenges:
- Few ground truth labels for model training & evaluation
- Limited signal from individual abusive accounts
- Adversarial in nature where abusers are quick to evolve
They share two unsupervised learning techniques that worked well: isolation forests and graph clustering.
Isolation forests are an ensemble of randomly grown binary trees. At each node, a random feature and split is chosen. The tree grows until all data is isolated in the leaf nodes. Why does this work? The intuition is that outliers will be easier to separate (i.e., fewer splits) and thus appear shallower in the tree.
Here’s two examples of accounts picked up by isolation forests. The x-axis represents the number of user actions, while the y-axis represents the outlier score.
In this example, the group of highlighted accounts (orange) are real members who use automation tools. The number of actions they take, and the outlier score, is fairly high, but they’re normal users.
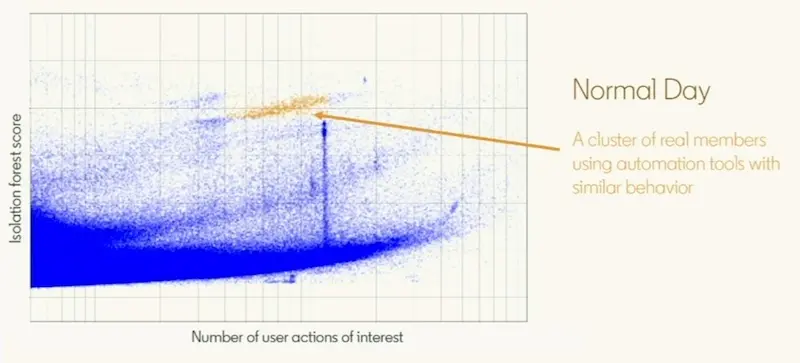
Normal users using automation tools have high outliers scores.
In this example, the group of highlighted accounts (red) are fake accounts created via automation. Visually, they’re well separated from the rest and appear as a thick swarm (of locusts) with outlier scores far above regular activity.
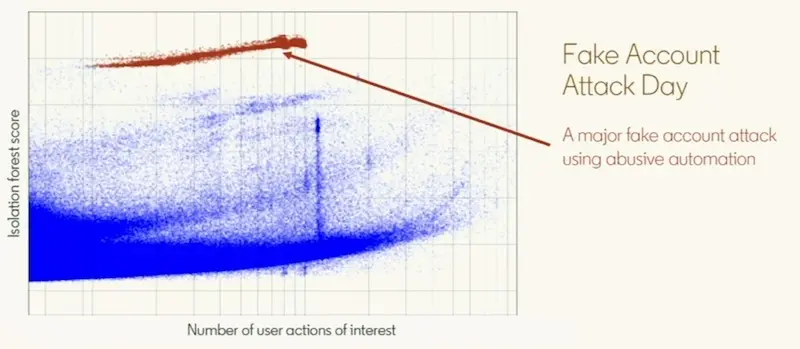
An attack shows up very clearly, despite the range of user actions to blend in.
Graph clustering is applied to identify networks of similar accounts based on signals (e.g., liking similar content). We can do this naively by computing similarity between all pairs of users. However, this is O(N^2) expensive. Thus, we can adopt the following optimisations:
- Exclude low activity customers (as they’re low risk)
- Exclude viral content (as they’re too noisy and little signal)
- Exclude pairs with no overlap in content engagement
To find networks, we can compute Jaccard Similarity between two accounts. Or more specifically, LinkedIn uses weighted Jaccard Similarity (aka Ruzicka similarity) as they represent user-content relationships as a value between 0 and 1. Next, Jarvis-Patrick clustering is applied to ensure that clusters are more homogeneous.
Here are some examples of fake accounts. In the top left, all accounts were engaged on the same piece of content. In the lower-middle, three groups of fake accounts were created to test the system.
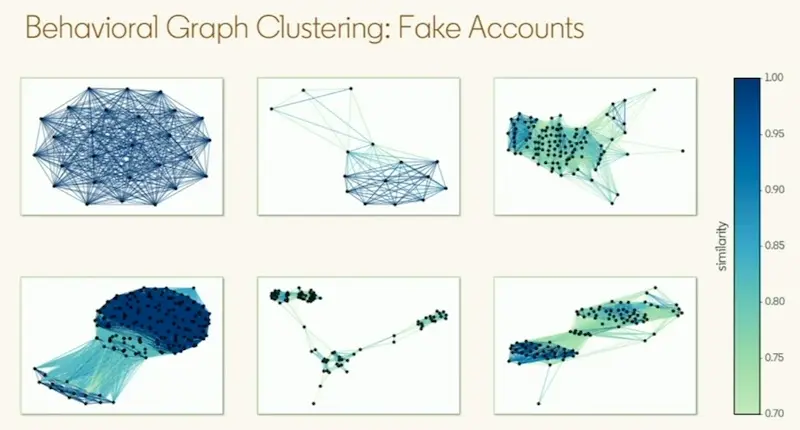
Networks of abusers engaging on the same content show up clearly, even when they add noise to blend in.
Nonetheless, there’re false positives too. Here, we see accounts that engage on similar content where members know each other from a book club, company, or interest group.
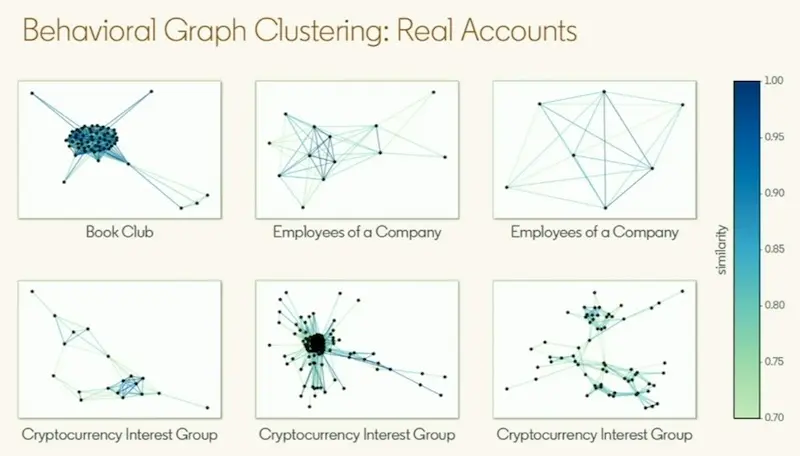
Nonetheless, real users and communities get picked up as well.
Thus, while unsupervised techniques are effective in identifying outliers, they have to be complemented with supervised techniques and heuristics to exclude false positives (i.e., real accounts that were incorrectly identified as fake).
Further reading:
- LinkedIn’s Isolation Forest GitHub
- Detecting and preventing abuse on LinkedIn using isolation forests
Production Reinforcement Learning at Zynga (25 June)
Patrick Halina (ML Engineering Lead) and Curren Pangler (Principal Software Engineer) share about Zynga’s journey into reinforcement learning for personalisation.
First, they started with rule-based segments. Program managers defined these segments and assigned personalised actions to each segment. However, this involved a lot of trial and error, had to be updated when player patterns change, and had limited personalization.
Then, they built machine learning models to predict long term reward for each action. However, this required a lot of labelled data and many individual models.
Currently, they’ve adopted reinforcement learning that can personalise actions for each user and continuously explore and improve over time. The daily message from Words With Friends has the time determined by a reinforcement learning agent. It led to a significant increase in CTR vs. a hand-tuned system.
Zynga’s tech stack uses TF-Agents at its core; it comes with many RL models, from the baseline (DQN, DDQN) to the cutting edge (PPO, SAC). There’s a wrapper (RL-Bakery) around it. RL-Bakery helps to build experience replays, orchestrate training pipelines, and deploy models.
Zynga also shared insights from their years of designing RL applications:
- Choose the right application: Is the problem best modelled as a sequence (of actions)? Is the reward learnable (i.e., not sparse)? If not, probably don’t use RL.
- Choose the right states: RL agents are sensitive to too many inputs; start with a simple state space.
- Choose the right actions: Start with a small set of discrete actions and use a baseline model (e.g., DDQN). Continuous action spaces require Policy Gradient methods.
- Pre-train on offline data: Warm-start RL agents to mimic existing behaviour based on historical data or hand-made scenarios. This way, it’ll have this (good) behaviour at launch and improve by learning from live data.
They also shared about how they automated hyperparameter tuning with MLflow.
Here’s my previous write-up and accompany GitHub on running rapid experiments using
Jupyter,Papermill, andMLflow.
Further reading:
- Deep Reinforcement Learning in Production at Zynga
- Portfolio-Scale Machine Learning at Zynga
- RL-Bakery GitHub
Adding These to a GitHub on Applied Machine Learning
Enjoy such application-specific content on machine learning?
So do I. So much that I’ve created a GitHub repo (applied-ml) for it. The examples from this write-up can be found there. I’ve also added other content I’ve come across.
If you enjoy such content and the repository, I would really appreciate if you give it a star and spread the word. Even better if you contributed content via a pull request. Thank you!
Check out the
applied-mlrepository here 🌟.
P.S., Want to share a summary of this article? Retweet the thread below!
My notes on app-specific talks @ @SparkAISummit 2020👇
— Eugene Yan (@eugeneyan) July 7, 2020
Airbnb's Sputnik: A Data Engineering Framework
• Removes boilerplate run logic so devs focus on job logic
• Bakes in best practices
• E.g., reduce file counts via repartition
• Easy batching of backfill jobs
If you found this useful, please cite this write-up as:
Yan, Ziyou. (Jul 2020). My Notes From Spark+AI Summit 2020 (Application-Specific Talks). eugeneyan.com. https://eugeneyan.com/writing/notes-from-sparkai-summit-application-specific/.
or
@article{yan2020spark2,
  title   = {My Notes From Spark+AI Summit 2020 (Application-Specific Talks)},
  author  = {Yan, Ziyou},
  journal = {eugeneyan.com},
  year    = {2020},
  month   = {Jul},
  url     = {https://eugeneyan.com/writing/notes-from-sparkai-summit-application-specific/}
}
Share on:
Browse related tags: [ machinelearning deeplearning production survey ] or
Join 11,800+ readers getting updates on machine learning, RecSys, LLMs, and engineering.