Simpler Experimentation with Jupyter, Papermill, and MLflow
P.S. Looking for the code? Available on github: papermill-mlflow
Your company (e.g., an e-commerce platform across several countries) is starting a new project on fraud detection. You begin by building a basic machine learning pipeline for a single country in a Jupyter notebook. The evaluation metrics for your basic, single-country pipeline looks good.
Next, you want to apply the same pipeline to the other countries—since the data format is identical—and run multiple experiments (e.g., feature selection, parameter tuning).
Ideally, each experiment’s output should be a self-contained Jupyter notebook for easy reference. You also want to store and access artifacts (e.g., visualizations, trained models) in a single location.
How should you do it?
The tedious, error-prone way
If you’re like me, you might duplicate that basic pipeline (basic.ipynb) and rename it (e.g., basic_sg.ipynb, basic_vn.ipynb, etc). One notebook per country.
However, as you experiment, you find some new features that improve results and want to replicate it across the countries. Thus, you copy-paste code across multiple notebooks. This violates the DRY principle and is pretty tedious.
To log the results in a single location, you output evaluation metrics for each experiment in a CSV. Visualizations (e.g, ROC curves, precision-recall curves) and trained model binaries are also stored in a single directory.
However, trying to match the visualizations (in the directory) to the experiment results (in the CSV) for reference is time-consuming. Ditto for the model binary.
Is there a simpler, more effortless way?
Streamlined, faster experiments
After some trial and error, I’ve settled on a workflow for simpler, faster experimentation. No more duplication of notebooks. All metrics, visualizations, and model binaries in a single UI.
There are three main components:
jupyter: Quick, iterative development and visualization of code and outputpapermill: Running one notebook with different parameters; output into separate notebooksmlflow: Logging of metrics and artifacts within a single UI
To demonstrate this, we’ll do the following:
- Build a demo ML pipeline to predict if the S&P 500 will be up (or down) the next day (performance is secondary in this post)
- Scale this pipeline to experiments on other indices (e.g., Gold, Nikkei, etc.)
- Automagically log all metrics and artifacts in a single location
Let’s get started.
Step 1: Zero to One (experiment)
In this notebook we have a basic pipeline doing some analysis, visualizations, feature engineering, and machine learning. At a high level, it:
- Loads S&P 500 data (downloaded from Yahoo finance)
- Creates basic features (e.g., simple and exponential moving average)
- Plots visualizations (e.g., trends, AUC curves, precision-recall curves)
- Runs statistical analyses (note: features are highly correlated and this is not entirely correct)
- Trains and evaluates models (e.g., logistic regression, decision trees, etc.)
The pipeline is simple—running it end-to-end takes 3.5 seconds. This allows for rapid, iterative experimentations.
More experiments = more learning = high probability of success.
Here’s how the notebook looks like: base.ipynb
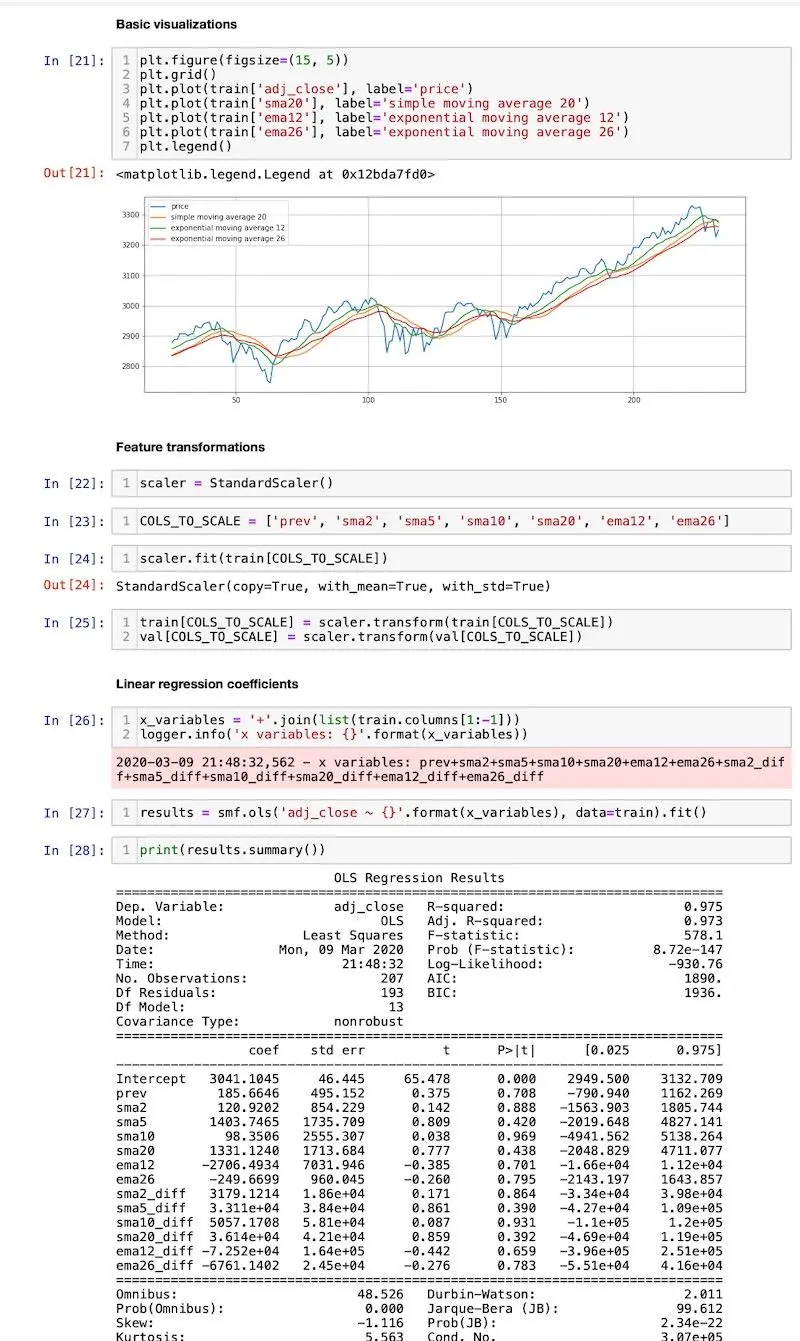
Screenshot from the base notebook
Step 2: One (notebook) to 100 (experiments)
To scale our single notebook (running the S&P 500 pipeline) to multiple other stock indices, we enlist the help of papermill.
Papermill allows you to parametrise and execute Jupyter notebooks. In this demo, we’ll set different parameters (e.g., INDEX = GOLD, INDEX = NIKKEI) for the same basic.ipynb notebook to experiment our pipeline on different stock indices. Each experiment is also saved to its own notebook (e.g., basic_SNP.ipynb, basic_GOLD.ipynb).
Using papermill to do this is easy—just two simple steps.
First, add a parameters tag to the cell in your notebook:
- Menu bar -> View -> Cell toolbar -> Tags
- Enter
parametersin the textbook on the top right of the cell - Click Add tag
Here, we’ve parameterized the third cell so we can set INDEX externally via papermill.

How to parameterize a cell
Next, we create a notebook (runner.ipynb) to run basic.ipynb with different parameters. Here’s a code snippet on how to do this, where we:
- Iterate through the various indices
- Execute
basic.ipynbwith different indices (via theparameterargument) - Save each notebook individually (e.g.,
basic_SNP.ipynb, ‘)
for index in ['SNP', 'GOLD', 'SSE', 'HANGSENG', 'NIKKEI']:
    logger.info('Running notebook for: {}'.format(index))
    pm.execute_notebook(input_path='basic.ipynb',
                  parameters={'INDEX': index}
                        output_path='../artifact_dir/notebooks/basic_{}.ipynb'.format(index))
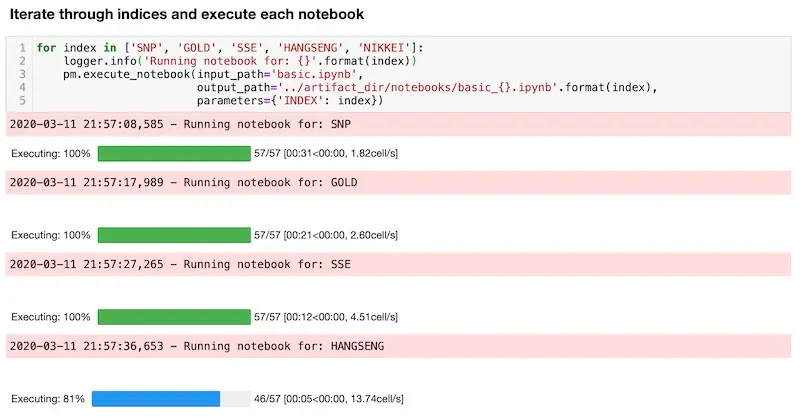
Running all the notebooks with Papermill
Now, wasn’t that simple?
With this approach, we minimize code duplication. Also, each experiment’s code, visualizations, and evaluation metrics are logged in a notebook, allowing easy reference and replication.
Nonetheless, how can we get an overall view of experiment results, without going through each notebook? Is there a way to group and store each experiments’ evaluation metrics, visualizations, and trained models? Can this then be consolidated and accessed from a single location?
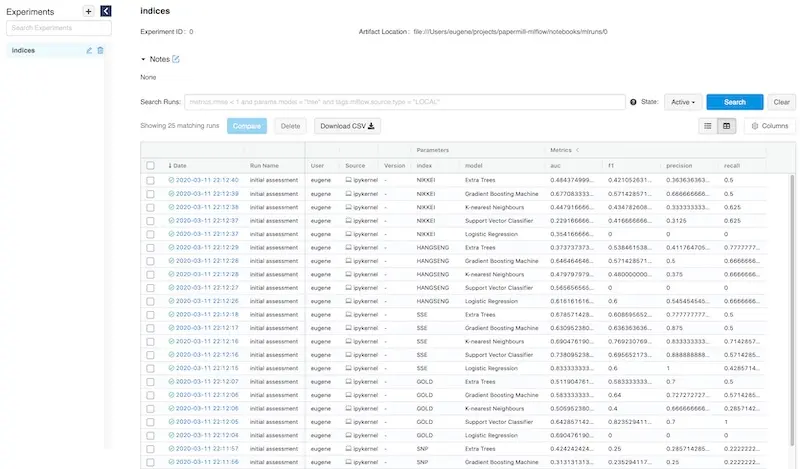
Step 3: 100 (metrics) in one (dashboard)
Each notebook trains five ML models and evaluates them on four metrics. For each model, we produce two graphs (i.e., ROC curve, precision-recall curve) and a model binary.
That’s 20 metrics, 10 graphs, and 5 model binaries per experiment run—this can quickly get out of hand.
To get this under control, we can use mlflow.
MLflow is a framework that helps with tracking experiments and ensuring reproducible workflows for deployment. It has three components (tracking, projects, models). This walkthrough will focus on the first which has an API and UI for logging parameters, metrics, artifacts, etc.
Automatically logging each experiment is easy with this snippet of code:
with mlflow.start_run():
    mlflow.log_param('index', index)
    mlflow.log_param('model', model_name)
    mlflow.log_metric('auc', auc)
    mlflow.log_metric('recall', recall)
    mlflow.log_metric('precision', precision)
    mlflow.log_metric('f1', f1)
    mlflow.log_artifact(model_path)
    mlflow.log_artifact(roc_path)
    mlflow.log_artifact(pr_path)
In the above, with every ML model trained, we log parameters (e.g., stock index, model name, secret sauce), metrics (e.g., AUC, precision), and artefacts (e.g., visualisations, model binaries). This is pretty basic and you can do it yourself with a bit of python code.
Where mlflow shines is its server and UI. Starting up the server (mlflow server) and navigating to the dashboard (127.0.0.1:5000) is easy. (The server can also be hosted centrally and users can push their metrics and artifacts to it.)
The MLflow UI consolidates all your parameters and metrics on a single homepage for easy viewing.
All your experiment metrics at your fingertips
You can sort experiments by metrics or parameters. Here, we sort it by AUC descending.
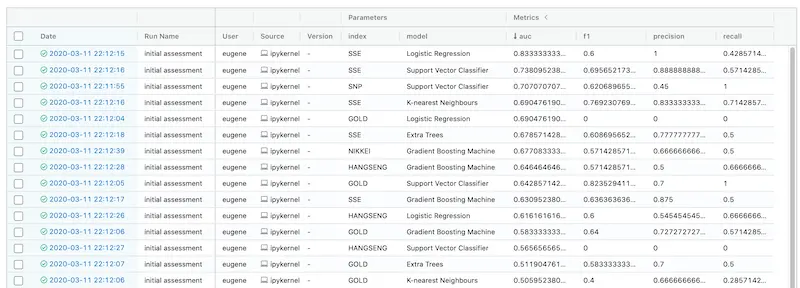
Looks like simple (logistic regression) is best
It also allows customer filters via parameters and metrics. Here’s we filter for Logistic Regression.
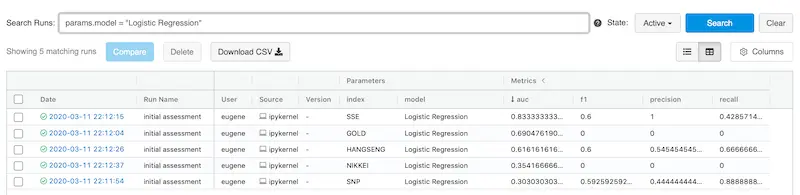
It's easy to filter your experiments based on parameters and/or metrics
But where are the artifacts from each experiment? Click on the experiment and you’ll be brought to the experiment page where you can view all your artifacts and download them.
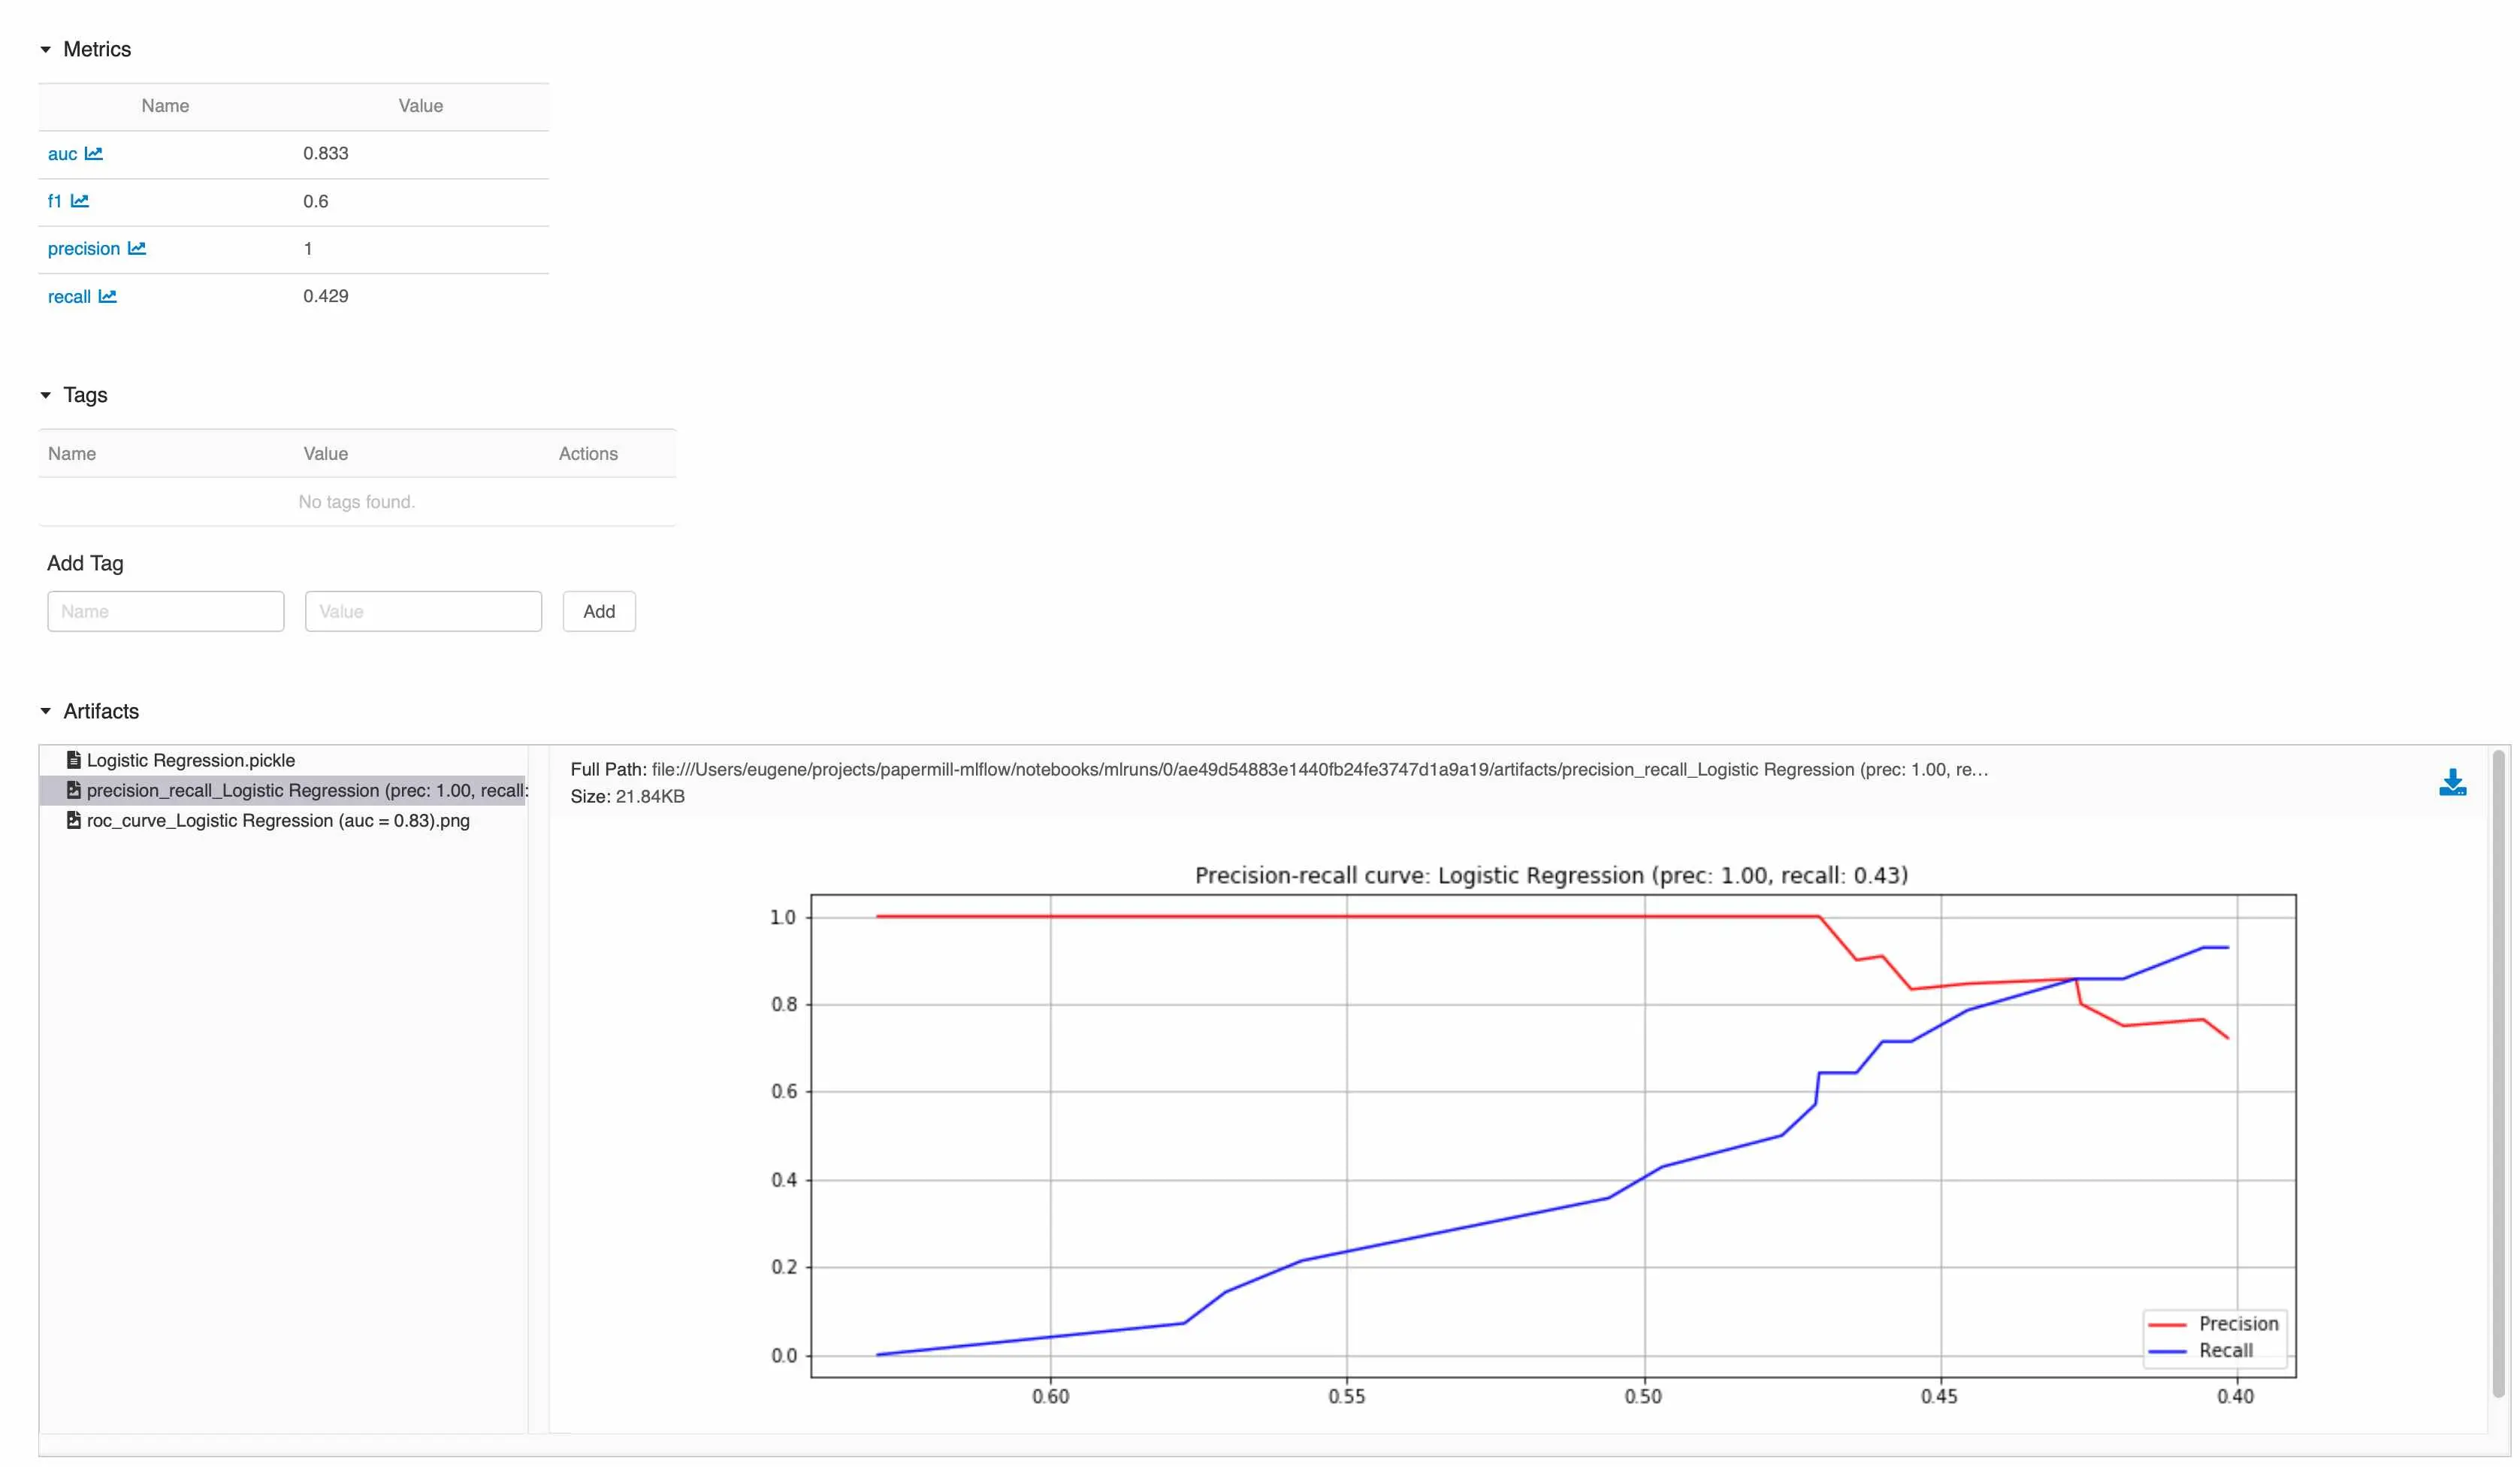
Everything (metrics, artefacts) about an experiment in one location
How to get started
In the walkthrough above, we saw how we could run multiple experiments from a single notebook (with papermill), and log the results and artifacts in a single UI (with mlflow).
Here’s the git repo to the notebooks used in the walkthrough. Clone it and try it. Give it a star if you found it useful. Actively try to integrate papermill and mlflow into your work.
Automate your experimentation workflow to minimize effort and iterate faster, increasing your chances of success.
Thanks to Gabriel Chuan and Michael Ng for reading drafts of this.
If you found this useful, please cite this write-up as:
Yan, Ziyou. (Mar 2020). Simpler Experimentation with Jupyter, Papermill, and MLflow. eugeneyan.com. https://eugeneyan.com/writing/experimentation-workflow-with-jupyter-papermill-mlflow/.
or
@article{yan2020automate,
  title   = {Simpler Experimentation with Jupyter, Papermill, and MLflow},
  author  = {Yan, Ziyou},
  journal = {eugeneyan.com},
  year    = {2020},
  month   = {Mar},
  url     = {https://eugeneyan.com/writing/experimentation-workflow-with-jupyter-papermill-mlflow/}
}
Share on:
Browse related tags: [ productivity python ] or
Join 11,800+ readers getting updates on machine learning, RecSys, LLMs, and engineering.