Evaluation & Hallucination Detection for Abstractive Summaries
Abstractive summarization is the task of generating a concise summary that captures the key ideas in the source document. It often involves rephrasing or condensing information from the original text. In contrast, extractive summarization lifts entire sentences from the original text to form a summary, without altering the content or structure of the sentences.
While it’s typically applied to news articles in the literature, I think the task of abstractive summarization is versatile and can be extended to applications such as:
- Summarize the gist of events (e.g., news) or legal changes (e.g., GDPR, DMA)
- Weekly snapshots of one’s lifestyle based on food receipts and sleep/exercise logs
- Naming a bundle of towel, sunscreen, and snorkel gear as “Beach Day Essentials”
But evaluating abstractive summaries is challenging—it’s not as straightforward as evaluating constrained translations or code generations that we can test for functionality. Also, how do check summaries for hallucination?
Here, we’ll first discuss the four dimensions for evaluating abstractive summarization before diving into reference-based, context-based, preference-based, and sampling-based metrics. Along the way, we’ll dig into methods to detect hallucination, specifically natural language inference (NLI) and question-answering (QA).
Fluency, Coherence, Relevance, Consistency
Kryscinski et al. (2019) proposed four dimensions for evaluating abstractive summaries:
- Fluency: Each sentence should be well-formed and free of grammatical errors or random capitalization that makes it hard to read
- Coherence: Collective quality of all sentences, where the summary should be well-structured and not just a heap of information
- Relevance: Picking the important aspects from the source document to include in the summary and excluding the rest
- Consistency: The summary and source document should be factually consistent aka faithful (i.e., no new information in the summary that’s not in the source)
Of these, fluency is now mostly solved given how well modern language models perform. A recent benchmark on abstractive summarization excluded it for this reason. In addition, coherence is less of an issue for short summaries that contain one or a few sentences though it becomes more critical in longer-form summaries.
Relevance is tricky to measure as it depends on the context and audience. While we can come to an agreement over which aspects of the source document are relevant enough for the summary, it’s ultimately subjective and likely differs from person to person. As a result, this makes it challenging to evaluate relevance automatically.
Last, we have consistency which is closely related to hallucination. Kryściński et al. (2020) found that hallucination affects up to 30% of summaries generated from CNN/DailyMail. More recently, Pagnoni et al. (2021) found similar errors on CNN/DailyMail, with as much as 43% faithfulness errors, and XSum having 92% faithfulness errors. Inconsistencies can occur due to simple negation flips, entity swapping (e.g., swapping the object and subject), and outright hallucination (adding entities or facts not in the document). In contrast to relevance, consistency is more objective and thus easier to evaluate automatically.
To be explicit, we distinguish between consistency and accuracy: A summary can be accurate but inconsistent if it adds accurate information that wasn’t in the source document. Previous work has shown that if a summary is inconsistent, it’s usually also inaccurate. Thus, we’ll focus on detecting inconsistency regardless of accuracy.
Reference-based metrics
The most commonly used evaluation metrics compare generated summaries to a gold reference summary. These include \(n\)-gram-based metrics and embedding-based metrics.
ROUGE (Recall-Oriented Understudy for Gisting Evaluation) is the most widely used metric for evaluating summarization. It counts the number of overlapping n-grams between the summary and references. ROUGE has several variants of which ROUGE-\(N\) is the most straightforward. It counts the number of matching \(n\)-grams between the output and the reference and we commonly see ROUGE-1 and ROUGE-2 metrics.
\[\text{ROUGE-N} = \frac{\sum_{s_r \in \text{references}} \sum_{n\text{-gram} \in s_r} \text{Count}_{\text{match}} (n\text{-gram})}{\sum_{s_r \in \text{references}} \sum_{n\text{-gram} \in s_r} \text{Count} (n\text{-gram})}\]Other variants include:
- ROUGE-L: This measures the longest common subsequence (LCS) between the output and the reference. It considers sentence-level structure similarity and zeros in on the longest series of co-occurring in-sequence n-grams.
- ROUGE-S: This measures the skip-bigram between the output and reference. Skip-bigrams are pairs of words that maintain their sentence order regardless of the words that might be sandwiched between them.
METEOR (Metric for Evaluation of Translation with Explicit ORdering) is another metric for abstractive summarization. It was partially motivated by the limitation of exact \(n\)-gram matching. Thus, it uses a relaxed matching criteria that does unigram matching on multiple levels in the following order:
- Exact word matching: Exact matches between reference and generation
- Stemmed matching: Exact matches after Porter stemming
- Synonym matching: Matches via WordNet synonyms
- Paraphrase matching: Matches on phrases that are structured differently
It then computes the F-score to consider both recall and precision:
\[P \text{ (Precision) } = \frac{\text{#mapped_unigrams}}{\text{#unigrams_in_candidate}}, R \text{ (Recall) } = \frac{\text{#mapped_unigrams}}{\text{#unigrams_in_reference}} \\\] \[\text{Fscore} = \frac{10 \times P \times R}{R + 9 \times P}\]Since METEOR only considers unigram matches, it rewards longer contiguous matches via a fragmentation penalty term. First, chunks of contiguous unigram matches are identified in the reference and summary. Thus, longer \(n\)-gram matches will lead to fewer chunks. And if there are no chunk matches, the number of chunks will be the same as the number of unigrams. This penalty is then added to the METEOR score:
\[\begin{align*} \text{Penalty} &= 0.5 \times \left( \frac{\text{#chunks}}{\text{#unigrams_matched}} \right)^3 \\ \text{METEOR Score} &= F_{\text{score}} \times (1 - \text{Penalty}) \end{align*}\]BERTScore is an embedding-based metric that extends on the spirit of METEOR. It uses cosine similarity to compare each token or n-gram in the generated summary with the reference. There are three components to BERTScore:
- Precision: Average cosine similarity between each token in the generated output and its nearest match in the reference.
- Recall: Average cosine similarity between each token in the reference and its closest match in the generated output.
- F1: Harmonic mean of precision and recall
BERTScore is useful because it accounts for synonyms and paraphrasing. Simpler metrics like ROUGE can’t do this due to their reliance on exact matches. BERTScore has been shown to have better correlation for tasks such as image captioning and machine translation.
MoverScore also uses contextualized embeddings to compute the distance between tokens in the generated output and reference. But unlike BERTScore, which is based on one-to-one matching (or “high alignment”) of tokens, MoverScore allows for many-to-one matching (or “soft alignment”).
 vs. MoverScore (right)")
BERTScore (left) vs. MoverScore (right; source)
MoverScore enables the mapping of semantically related words in one sequence to their counterparts in another sequence. It does this by solving a constrained optimization problem that finds the minimum effort to transform one text into another. The idea is to measure the distance that words would have to move to convert one sequence to another.
Unfortunately, the need for references is a bottleneck, especially if our summarization task is based on documents that are of a different distribution from available references (typically news articles). Collecting references for each new task is time-consuming: we’ll need to write guidelines, train annotators, and continuously audit for quality.
Second, even if we have reference summaries, they may not be better than automatically generated summaries. Thus, it may not make sense to evaluate generated summaries against these poorer references.
For example, Fabbri et al. (2021) found that reference summaries in CNN/DailyMail scored poorly on relevance, consistency, and coherence. These references were outperformed by T5, BART, and Pegasus. This was because the references often contain extra information, such as hyperlinks or clickbait, which reduced relevance and consistency. Furthermore, many reference summaries in CNN/DailyMail were naive concatenations of the original bullet-point summaries into paragraphs—this negatively affected coherence.

References in CNN/DM score lower than T5, BART, Pegasus (source)
More recently, Zhang et al. (2023) also found LLMs to surpass reference summaries (across similar dimensions) in CNN/DailyMail and XSum because the reference summaries were of such low quality. Furthermore, applying in-context learning using the reference led to worse generated summaries (e.g., faithfulness dropped from 0.97 to 0.77 on XSum). This suggests that the poor quality of references as few-shot examples degraded model output.

Existing references are surpassed by LLMs (source)
Thus, if collecting reference summaries is a bottleneck, and if those references aren’t better than generated summaries, what can we do?
Context-based (reference-free) metrics
One idea is to do away with references completely and evaluate based on the context (i.e., source document) instead. We can start by adapting the reference-based metrics above.
ROUGE-C is a modification to ROUGE: Instead of comparing to a reference summary, the generated summary is compared to the source document:
\[\text{ROUGE-C-N} = \frac{\sum_{s_h \in \text{summary}} \sum_{n\text{-gram} \in s_h} \text{Count}_{\text{match}}(n\text{-gram})}{\sum_{s_c \in \text{document}} \sum_{n\text{-gram} \in s_c} \text{Count}(n\text{-gram})}\]Here, \(s_h\) and \(s_c\) are sentences belonging to the summary and document respectively. (\(h\) = hypothesis and \(c\) = context). Additionally, if the summarization task has an input query (i.e., create a summary that answers the given query from the document), ROUGE-C is:
\[\text{ROUGE-C} = \lambda \cdot \text{ROUGE-C}_{QF} + (1 - \lambda) \cdot \text{ROUGE-C}_D\]\(\text{ROUGE-C}_D\) is the ROUGE-C score when the document is used as context and \(\text{ROUGE-C}_{QF}\) is the ROUGE-C score when the query information (e.g., question, description) is used as context. \(\lambda\) is then used to weigh them both. Nonetheless, while the simplicity of ROUGE-C is appealing, it doesn’t seem as widely used in the literature and there hasn’t been further work demonstrating its validity as a metric.
Similarly, we can adapt BERTScore and MoverScore to compute similarity between generated summaries and source documents. The straightforward approach is to simply embed the entire source document. Nonetheless, if the document is too long it can reduce the fidelity of the embedding. One solution is to chunk the document by sections or paragraphs before embedding them and doing the embedding comparison.
Another approach is to evaluate summaries with a strong LLM. One such approach is G-Eval, a framework that applies LLMs with Chain-of-Thought (CoT) and a form-filling paradigm to evaluate LLM outputs. First, they provide a task introduction and evaluation criteria to an LLM and ask it to generate a CoT of evaluation steps. Then, to evaluate coherence in news summarization, they concatenate the prompt, CoT, news article, and summary and ask the LLM to output a score between 1 to 5. They then use the probabilities of the output tokens from the LLM to normalize the score and take their weighted summation as the final result.

Overview of G-Eval (source)
They found that GPT-4 as an evaluator had a high Spearman correlation with human judgments (0.514), outperforming all previous methods. For summarization, it surpassed all previous SOTA evaluators on the SummEval benchmark which considers coherence, consistency, fluency, and relevance.

Comparison of results in G-Eval (source)
Nonetheless, they also found that G-Eval based on GPT-4 always gives higher scores to GPT-3.5 summaries than human-written summaries, even when human judges prefer human-written summaries.
Detecting inconsistencies / non-faithful output with the source document
There are two main approaches to detect inconsistency in the literature: entailment-based metrics and QA (question-answering) metrics.
Entailment metrics are based on the natural language inference (NLI) task where a hypothesis sentence is classified as entailed by, neutral, or contradicting a premise sentence. To evaluate abstractive summarization for consistency, we check if the summary is entailed by the source document.
SummaC showed that NLI models can be effectively used for consistency evaluation if they’re applied at the appropriate granularity. In the example below, if we treat the entire document as the premise, the NLI model incorrectly predicts that the summary is entailed by the document with a probability of 0.91. But if we split the document and summary into sentences, the NLI model correctly identifies the last summary sentence as not entailed by any sentence in the document.

Entailment metrics at paragraph vs. sentence level (source)
Here’s how they compute entailment for each sentence before getting an overall score. First, they apply an NLI model (BERT variants) to compute the entailment probability between each document-summary sentence-pair. The result is an NLI pair matrix that’s based on all possible sentence combinations. They then evaluated two approaches, Zero Shot and Convolution, to compute a single score for the entire summary.
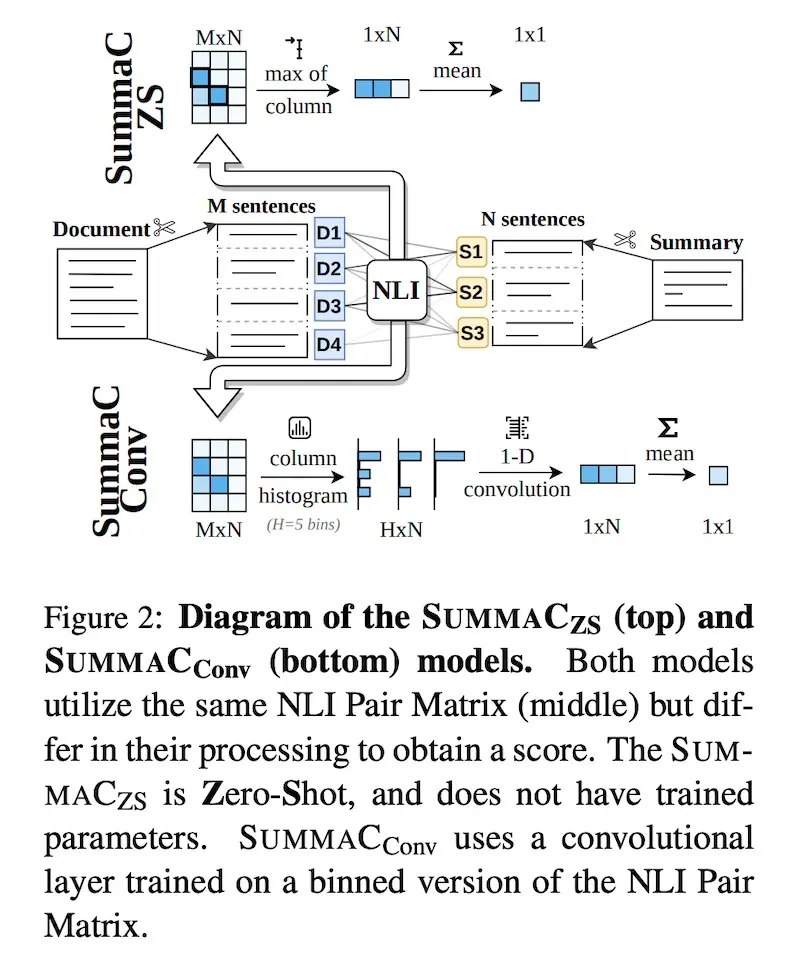
Zero-shot vs. Convolution aggregation (source)
For \(\text{SummaC}_{ZS}\), they reduce the pair matrix into a one-dimensional vector by taking the maximum value in each column. Intuitively, this results in retaining the score for the document sentence that provides the strongest support for each summary sentence. Then, to get a single score for the entire summary, they simply compute the mean of the vector.
For \(\text{SummaC}_{Conv}\), they wanted to address the limitation of \(\text{SummaC}_{ZS}\) which can be noisy due to outliers and the imperfect nature of NLI. Thus, for each summary sentence, a learned convolutional layer converts the entire distribution into a single score. To do this, they first convert the scores for each summary sentence into a histogram with 50 bins. The binned matrix is then passed through a 1-D convolution layer with kernel size = 50. Finally, similar to \(\text{SummaC}_{ZC}\), the overall score is a mean of each summary sentence score.
SummaC outperformed several baselines on six summarization datasets, with \(\text{SummaC}_{Conv}\) doing better than \(\text{SummaC}_{ZS}\) most of the time. The latter suggests that considering the entire distribution of scores for each summary sentence—instead of only the maximum—to be useful. (Nonetheless, other benchmarks have found \(\text{SummaC}_{ZS}\) to outperform \(\text{SummaC}_{Conv}\). These same benchmarks also found basic sentence-level MNLI/ANLI models to outperform SummaC.)

Results for SummaC Zero Shot and Convolution(source)
They also conducted an ablation study across various levels of granularity: full text, paragraph, two-sentence, and sentence. Finer granularities led to better performance, with sentence and two-sentence level comparisons having higher performance. This suggests that NLI tasks for summarization can benefit from more granular comparisons.
TrueTeacher shows how we can distill an NLI model via synthetic NLI labels derived from annotating model-generated summaries via an LLM. Thus, it is not dependent on existing NLI data or human-written summaries.

Getting an LLM to label summaries (source)
First, they finetuned a variety of pretrained language models (T5-small to T5-11B) on the summarization task via XSum. Then, they use these models to generate summaries on a different dataset, CNN/DailyMail. Finally, an LLM (FLAN-PaLM 540B) is prompted to label the summaries on consistency. They applied zero-shot prompts for simplicity—earlier trials with few-shot and chain-of-thought prompts did not improve performance. This process generated 1.4M synthetic examples (🤯).

Generating synthetic labels (source)
For the NLI model, they finetuned T5-11B on the 1.4M synthetic examples mixed with ANLI. Adding the synthetic samples improved the best model (T5-11B with ANLI-only) from ROC-AUC of 82.7 to 87.8. The finetuned NLI model also outperformed the 50x larger FLAN-PaLM 540B. (Interestingly, the results also showed that simpler NLI approaches, albeit with a larger T5-11B model, can outperform SummaC.)

A comparison across NLI models for evaluating consistency (source)
An alternate approach to assessing consistency is metrics based on question generation (QG) and question answering (QA). This typically involves:
- Selecting answers to ask questions about
- Generating questions conditioned on those answers and the document/summary
- Answering questions based on the summary/document
- Evaluating overlap between the selected answers and the QA model output
QA metrics can be recall-oriented or precision-oriented. In the former, we generate questions from the source document and then assess if a QA model can answer them based on the summary. In the latter, we generate questions from the summary and check if a QA model can answer them based on the source
QuestEval combines both recall and precision-oriented metrics by generating questions from both the source document and the summary. For question generation (\(Q_G\)), they fine-tune a T5 model to maximize the likelihood of generating human questions given the answer and document. Named entities and nouns were used as ground-truth answers. For question answering (\(Q_A\)), they used a pretrained T5 which extracts answers from the document given the question.
Precision is defined as the summary being consistent with the source text: Given a question \(q\), does the answer \(r\) differ when conditioned on the summary \(S\) and when conditioned on the document \(D\)? Thus, precision is computed as:
\[P_{\text{rec}}(D, S) = \frac{1}{|Q_G(S)|} \sum_{(q,r) \in Q_G(S)} F_1(Q_A(D, q), r)\]Recall is defined as the summary containing the important information from the source document, formulated as:
\[\text{Rec}(D, S) = \frac{\sum_{q,r \in Q_G(D)} W(q, D) (1 - Q_A(|S, q))}{\sum_{q,r \in Q_G(D)} W(q, D)}\]\(Q_G(D)\) is the set of all question-answer pairs for the source text \(D\) while \(W(q, D)\) is the weight of the query \(q\) for text \(D\). \(W\) is a query weighter model.

Combining precision and recall-oriented metrics in QuestEval (source)
The query weighter \(W\) is trained to distinguish between important questions and anecdotal ones. The goal is to reduce the weightage of less important questions on the recall metric. To train \(W\), they used existing summarization datasets. Given a source document \(D\), each question is labeled as important if the reference summary contains the answer.
Finally, recall and precision are combined by computing their harmonic mean:
\[\frac{2 \times \text{Precision} \times \text{Recall}}{\text{Precision} + \text{Recall}}\]Intuitively, they found that relevance is better measured by recall-oriented metrics, where SummaQA correlates better with relevance than consistency. Conversely, consistency is better measured by precision-oriented metrics, where QAGS correlates better with consistency than relevance. Naturally, QuestEval outperforms all the baselines.

Comparison of results in QuestEval (source)
QAFactEval also proposed a consistency metric based on QA and includes a comparison across NLI and QA baselines. The comparison is especially helpful as it includes simpler baselines such as MNLI (RoBERTa-large finetuned on MNLI), ANLI (RoBERTa-large finetuned on ANLI), and \(\text{SummaC}_{ZS}\).
For question generation, they tried BART and T5 finetuned on various datasets such as SQuAD, QA2D, UnifiedQA, etc. BART-large finetuned on QA2D worked best. For question answering, they tried Electra and T5 and found minor differences between each model-data combination. The best QG and QA made up QAFactEval. They also ensembled QAFactEval with an NLI model (\(\text{SummaC}_{Conv}\)) as QAFactEval-NLI.
The results showed QAFactEval outperforming the previous best QA metric (QuestEval). Nonetheless, QAFactEval is only slightly better than the simpler MNLI and ANLI models. (Surprisingly, in contrast to the SummaC paper, \(\text{SummaC}_{ZS}\) and \(\text{SummaC}_{Conv}\) performed poorer than MNLI and ANLI here—we also saw this in the TrueTeacher paper.)

Good comparison of NLI and QA-based metrics (source)
Preference-based metrics
“Preference-based” metrics are a middle ground between reference-based and context-based metrics. For example, a reward model trained on human preferences of abstractive summaries. In contrast to collecting summaries written from scratch, collecting human judgments on generated summaries takes lesser effort (e.g., pairwise comparisons, Likert scale) and can be done at a higher quality.
Böhm et al. (2019) trained a reward model on 2,500 summaries of 500 news articles in CNN/DailyMail. Five independent annotators rated the summaries in terms of fluency, redundancy, and overall quality on a 3-point Likert scale (-1 to 1).
The reward model takes the document and summary as input, and returns the reward (-1 to 1) as output. The goal is to train a reward model (\(R\)) that is as close to human ratings (\(R^*\)) as possible. They explored two loss functions for reward learning.
Regression loss tries to minimize the MSE error between \(R^*\) and the scores from the \(R\):
\[L^{\text{MSE}}(\theta) = \frac{1}{|X| \cdot N} \sum_{x \in X} \sum_{i=1}^{N} \left[ R^*(x, y_{i_x}) - R(x, y_{i_x}; \theta) \right]^2\]Cross-entropy loss tries to reduce disagreement between \(R^*\) and \(R\). In other words, for a pair of summaries, do \(R^*\) and \(R\) agree and prefer the same summary? For two summaries \(y^i_x, y^j_x \in Y_x\), they estimate the likelihood that \(R\) prefers \(y^i_x\) over \(y^j_x\) like so:
\[P(y_{i_x} \succ y_{j_x}) = \frac{\exp(r_i)}{\exp(r_i) + \exp(r_j)}\]\(r_i\) is the reward for \(y^i_x\) and \(r_j\) is the reward for \(y^j_x\). Then, given \(N\) summaries in \(Y_x\), they construct \(N \cdot (N-i)/2\) pairs of summaries for each input \(x\). Finally, they minimize disagreement between \(R^*\) and \(R\) via cross-entropy loss below:
\[\begin{align} L^{\text{CE}}(\theta) = - \frac{1}{|X| N (N - 1)/2} \sum_{x \in X} \sum_{i=1}^{N} \sum_{j > i}^N \Bigg\{ & 1[R^*(x, y_{i_x}) > R^*(x, y_{j_x})] \log P(y_{i_x} \succ y_{j_x}) + \nonumber \\ & 1[R^*(x, y_{j_x}) > R^*(x, y_{i_x})] \log P(y_{j_x} \succ y_{i_x}) \Bigg\} \end{align}\]They tried various text encoders (CNN-RNN, PMeans-RNN, BERT) and reward model architectures (MLP, SimRed). MLP + BERT worked best.

Comparison of results across various encoders and models (source)
Stiennon et al. (2020), the predecessor of InstructGPT, extended this by training a reward model to evaluate abstractive summaries of Reddit posts. Wu et al. (2021) also did similar work with fiction novels. The Reddit data (“TL;DR”) contains 123,619 posts with human-written TL;DRs of 24 to 48 tokens. They chose TL;DR over the more commonly used CNN/DailyMail because strong performance could already be achieved on the latter with simple extractive baselines.
The reward model is initialized with a supervised language model that was instruction-tuned (on pre-trained GPT-3) to generate summaries given a post. They then add a randomly initialized linear head that outputs a scalar value. They train the model to predict which summary, \(y_0\) or \(y_1\), is better given a post \(x\). This was based on a dataset of human ratings \(D\) and the loss function below:
\[\text{loss}(r_{\theta}) = - \mathbb{E}_{(x, y_0, y_1, i) \sim D} \left[ \log \left( \sigma \left( r_{\theta}(x, y_i) - r_{\theta}(x, y_{1-i}) \right) \right) \right]\]After training, they normalized the reward model output such that the reference summaries from TL;DR achieve a mean score of zero.
Though it was only finetuned on TL;DR summaries, the reward models generalizes to CNN/DailyMail summary evaluations. They agreed with labeler preference 62.4% (1.3B model) and 66.5% of the time (6.7B model). In comparison, inter-labeler agreement on CNN/DailyMail is 66.9%.
Overall, relative to reference-based metrics, preference-based metrics (and reward modeling) provide a simpler solution. Nonetheless, defining the reward will likely be tricky, as well as collecting human judgments. For example, human judges may bias towards coherent but non-faithful summaries over less coherent but strictly faithful summaries. As a result, such bias will seep into the metric which may introduce inconsistency and hallucination when finetuning and selecting models.
Sampling-based metrics
We can also adapt SelfCheckGPT to evaluate summaries on consistency. SelfCheckGPT was motivated by the need to fact-check LLMs without having reference answers. Thus, they adopt a sampling-based approach. The assumption: If an LLM has knowledge of a given concept, sampled responses are likely to be similar and consistent. However, if the concept is hallucinated, stochastically sampled responses (i.e., higher temperature) are likely to diverge and contradict one another.

The SelfCheckGPT process (source)
To evaluate consistency, they tried BERTScore, multiple-choice QA, and a simple n-gram model. For data, they generated synthetic Wikipedia articles via GPT-3 based on Wikibio. Then, they manually annotated sentence-level faithfulness on the generated data.
Interestingly, the simpler unigram model worked better than BERTScore and QA-based methods. In a nutshell, this method picks the token with the lowest occurrence among all the samples (\(N = 20\)). Thus, if a unigram only appears a few times, it is likely non-faithful.

PRAUC across various approaches on sentence-level detection (source)
This approach can also be adapted to abstractive summaries. We can generate multiple summaries from a source document and compare them for consistency. Comparisons can be done via n-gram or cosine similarity metrics mentioned above.
• • •
While generating abstractive summaries is now as simple as calling an API or using a pre-trained LLM, evaluating the output is still challenging. In the literature, balanced accuracy for detecting inconsistency on thoroughly studied datasets such as CNN/DailyMail and XSum ranged from 60 - 75% in SOTA approaches such as SummaC and QAFactEval.
Furthermore, most papers report performance based on correlations with human annotations—unfortunately, this is less interpretable relative to ROC AUC, recall, or precision, and makes it difficult to estimate their performance in a production setting. Finally, we’ve also seen that these gold references are fairly low in quality.
That said, how might we go about evaluating abstractive summaries? Here’s a pragmatic approach that iteratively adds sophistication:
- If we have references available, we can start with straightforward reference-based metrics such as ROUGE, METEOR, BERTScore, and MoverScore.
- If we don’t have references, we can try adapting reference-based metrics to compare summaries with source documents instead.
- We can also finetune and apply an NLI model to evaluate on consistency.
- If inference is not too costly, we can also use a sampling-based approach to assess for consistency among multiple summaries generated for the same document.
- We can also consider using a strong LLM to evaluate summaries (though we might also have to evaluate the evaluator).
- If preference data is available, we can try training a reward model as an evaluator.
- Finally, if more performance is needed, we can consider QA-based metrics. Nonetheless, this is complex with many components, such as selecting answers, finetuning QG and QA models, and evaluating answer overlap
That’s all for now. What other ways are there to evaluate abstractive summaries and/or detect inconsistency? Please reach out!
References
- Kryściński, Wojciech, et al. “Neural text summarization: A critical evaluation.” arXiv preprint arXiv:1908.08960 (2019).
- Zhang, Tianyi, et al. “Benchmarking large language models for news summarization.” arXiv preprint arXiv:2301.13848 (2023).
- Kryściński, Wojciech, et al. “Evaluating the factual consistency of abstractive text summarization.” arXiv preprint arXiv:1910.12840 (2019).
- Pagnoni, Artidoro, Vidhisha Balachandran, and Yulia Tsvetkov. “Understanding factuality in abstractive summarization with FRANK: A benchmark for factuality metrics.” arXiv preprint arXiv:2104.13346 (2021).
- Maynez, Joshua, et al. “On faithfulness and factuality in abstractive summarization.” arXiv preprint arXiv:2005.00661 (2020).
- Lin, Chin-Yew. “Rouge: A package for automatic evaluation of summaries.” Text summarization branches out. 2004.
- Banerjee, Satanjeev, and Alon Lavie. “METEOR: An automatic metric for MT evaluation with improved correlation with human judgments.” Proceedings of the acl workshop on intrinsic and extrinsic evaluation measures for machine translation and/or summarization. 2005.
- Zhang, Tianyi, et al. “Bertscore: Evaluating text generation with bert.” arXiv preprint arXiv:1904.09675 (2019).
- Zhao, Wei, et al. “MoverScore: Text generation evaluating with contextualized embeddings and earth mover distance.” arXiv preprint arXiv:1909.02622 (2019).
- Fabbri, Alexander R., et al. “Summeval: Re-evaluating summarization evaluation.” Transactions of the Association for Computational Linguistics 9 (2021): 391-409.
- He, Tingting, et al. “ROUGE-C: A fully automated evaluation method for multi-document summarization.” 2008 IEEE International Conference on Granular Computing. IEEE, 2008
- Liu, Yang, et al. “Gpteval: Nlg evaluation using gpt-4 with better human alignment.” arXiv preprint arXiv:2303.16634 (2023).
- Laban, Philippe, et al. “SummaC: Re-visiting NLI-based models for inconsistency detection in summarization.” Transactions of the Association for Computational Linguistics 10 (2022): 163-177.
- Gekhman, Zorik, et al. “Trueteacher: Learning factual consistency evaluation with large language models.” arXiv preprint arXiv:2305.11171 (2023).
- Scialom, Thomas, et al. “Answers unite! unsupervised metrics for reinforced summarization models.” arXiv preprint arXiv:1909.01610 (2019).
- Durmus, Esin, He He, and Mona Diab. “FEQA: A question answering evaluation framework for faithfulness assessment in abstractive summarization.” arXiv preprint arXiv:2005.03754 (2020).
- Scialom, Thomas, et al. “Questeval: Summarization asks for fact-based evaluation.” arXiv preprint arXiv:2103.12693 (2021).
- Fabbri, Alexander R., et al. “QAFactEval: Improved QA-based factual consistency evaluation for summarization.” arXiv preprint arXiv:2112.08542 (2021).
- Böhm, Florian, et al. “Better rewards yield better summaries: Learning to summarise without references.” arXiv preprint arXiv:1909.01214 (2019).
- Stiennon, Nisan, et al. “Learning to summarize with human feedback.” Advances in Neural Information Processing Systems 33 (2020): 3008-3021.
- Wu, Jeff, et al. “Recursively summarizing books with human feedback.” arXiv preprint arXiv:2109.10862 (2021).
- Manakul, Potsawee, Adian Liusie, and Mark JF Gales. “Selfcheckgpt: Zero-resource black-box hallucination detection for generative large language models.” arXiv preprint arXiv:2303.08896 (2023).
OG image prompt: “Summarizing the patterns of text on the internet –ar 2:1”
If you found this useful, please cite this write-up as:
Yan, Ziyou. (Sep 2023). Evaluation & Hallucination Detection for Abstractive Summaries. eugeneyan.com. https://eugeneyan.com/writing/abstractive/.
or
@article{yan2023abstractive,
  title   = {Evaluation & Hallucination Detection for Abstractive Summaries},
  author  = {Yan, Ziyou},
  journal = {eugeneyan.com},
  year    = {2023},
  month   = {Sep},
  url     = {https://eugeneyan.com/writing/abstractive/}
}
Share on:
Browse related tags: [ llm eval survey ] or
Join 11,800+ readers getting updates on machine learning, RecSys, LLMs, and engineering.